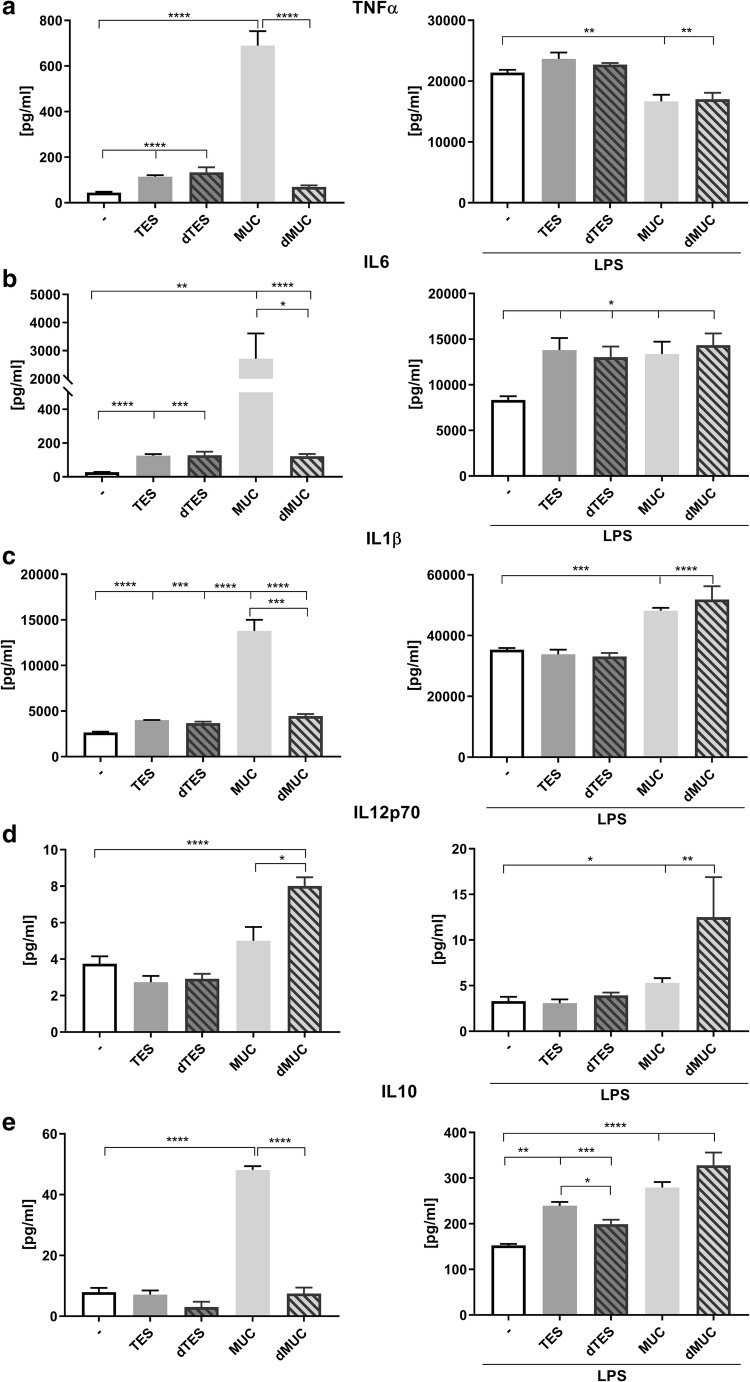
Fig. 1.
Cytokine production by THP-1 macrophages stimulated with: TES; deglycosylated TES (dTES); recombinant mucins (MUC); deglycosylated mucins (dMUC), and unstimulated control cells with and without simultaneous LPS treatment. Results are presented as mean of calculated concentration [pg/ml] ± SD. Statistical analysis was performed by Student’s t test. A value of P < 0.05 was considered to be significant. Significant differences between groups are marked with: *p < 0.05, **p < 0.01, ***p < 0.001, **** p < 0.0001, a-e

