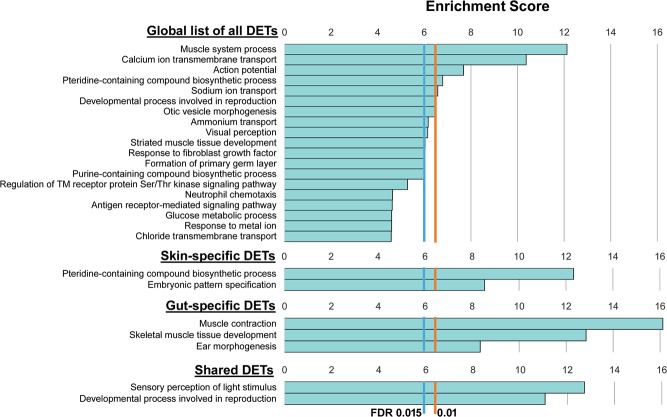
Figure 4.
Functional enrichment analyses. Bar graphs show the main functionally related networks (groups) of Biological Processes that were overrepresented in the global list of 573 candidate DETs between pigmented and pseudo-albino fish, and in the tissue specific or shared DETs lists. Enrichment for gene ontology (GO) terms was carried out using the ClueGO plugin and Cytoscape software with the minimum significance set at 0.05 FDR. Represented groups had a significant enrichment (FDR < 0.05) and associated related significant GO terms according to their functional classification. Each group is labelled after its most significant term. Bar length corresponds to the significance of each group in the ClueGO network output measured by enrichment score (−log2 (group FDR). Vertical lines show significance thresholds of higher stringency: FDR 0.015 (enrichment score = 6) or FDR 0.01 (enrichment score 6.6). For detailed lists of all significantly enriched GO terms and groups consult Supplementary Tables S5 and S6.

