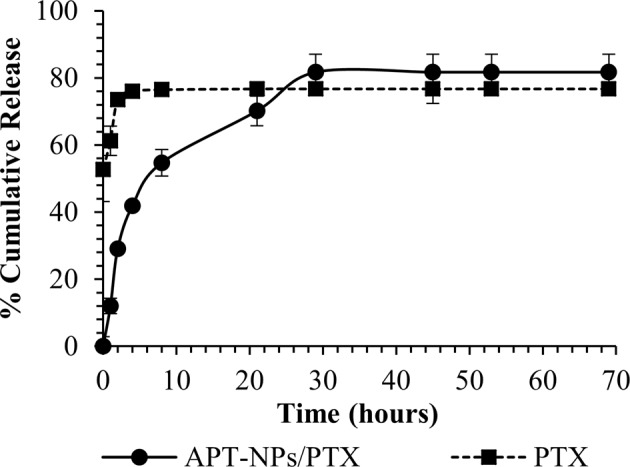
Fig. 6. Drug Release kinetics.

In vitro (cell free) drug release profile of PTX-loaded APT-NPs (black line) compared to unencapsulated PTX (dashed line). One ml of APT-NPs/PTX or PTX was suspended in 30 mL of PBS containing 0.1% Tween 80 and incubated at pH 7.4, 37 °C with agitation. At designated time points, the 30 ml PBS containing Tween 80 was replaced by fresh buffer. The samples were freeze-dried and then dissolved in ACN. The amount of PTX at each time point was quantified by HPLC. Data represent means ± SE, n = 3.
