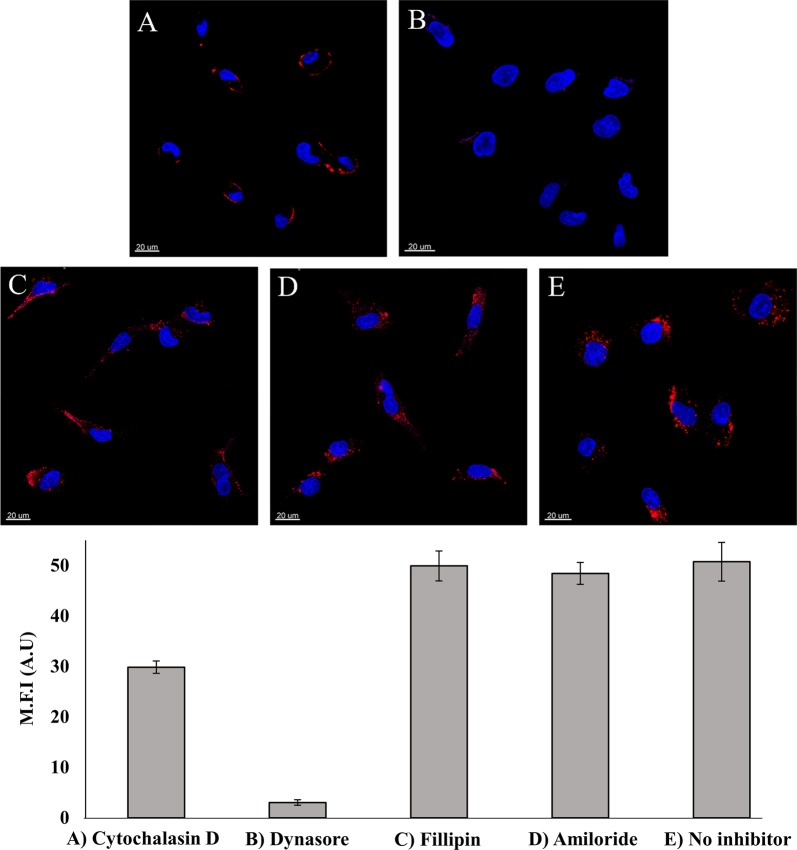
Fig. 7. Disruption of endocytosis by pre-incubation of A549 cells with different inhibitors.
Top: a 10 μM Cytochalasin D for 30 min; b 80 μM Dynasore for 30 min; c 1 mM Amiloride for 10 min; d 1 μg/ml Filipin for 30 min; and e drug-free medium; followed by incubation with 14 µM APT (30)-NPs for 2 h. Nuclear DNA was labeled with Hoechst 33342; Bottom: Mean fluorescence intensity (M.F.I) values of APT(30)-NPs in A549 cells incubated with different inhibitors were determined with IMARIS software for analysis of image data. The red fluorescence channel was defined between 10 and 100 for all images presented. Values presented are means ± SE.

