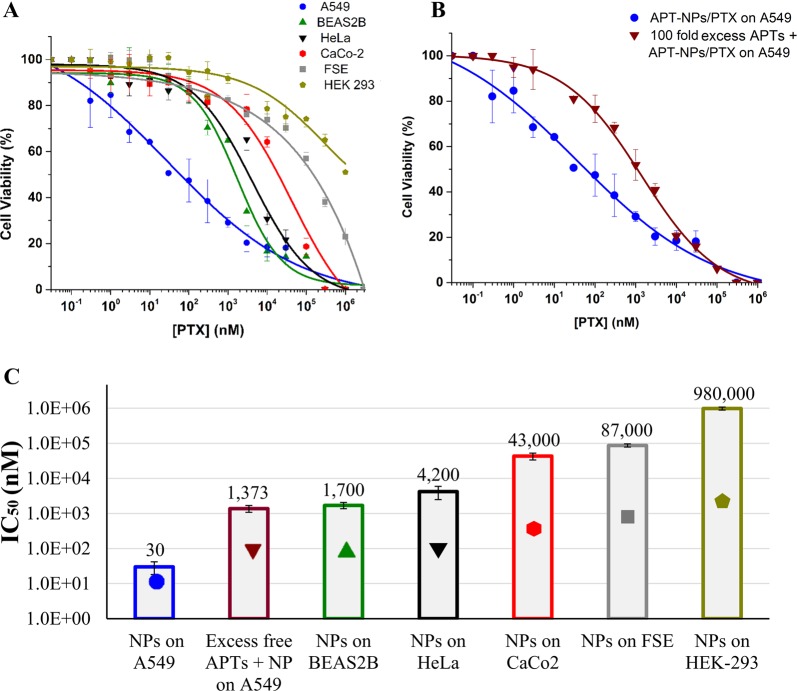
Fig. 8. Selective cytotoxicity to A549 target cells.
Cell viability as a function of PTX concentration of: a APT-NPs entrapping PTX (2.5:1 molar ratio) were added to A549 target cells and to BEAS2B, HeLa, CaCo-2, FSE, and HEK-293 cells; b APT-NPs entrapping PTX (2.5:1 molar ratio) added to A549 target cells vs. competitive binding conditions using a 100-fold excess of free S15-APTs, co-incubated with APT-NPs entrapping PTX. Values presented are means ± SE. Sigmoidal model curve were fitted using Eq. (3); c IC50 values derived from the fitted dose-response curves; P-values obtained were <0.01 for BEAS2B and HeLa cells, <0.001 for CaCo2 and HEK-293 cells, and <0.0001 for FSE cells. (Symbols marked on the bars are only for identification).

