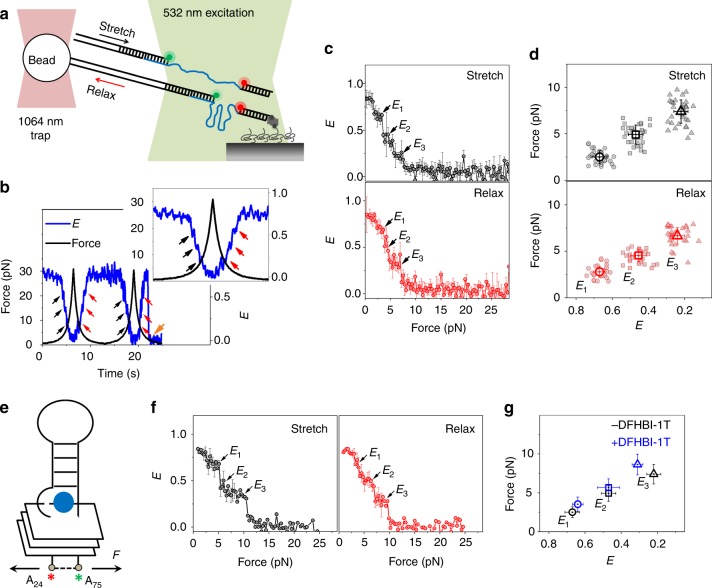
Fig. 2.
Conformational dynamics of Spinach2 under tension. a Schematic of integrated fluorescence-force spectroscopy assay: the Spinach2 construct is immobilized on a neutravidin coated quartz surface via a biotinylated strand. The other end is connected to an optically trapped 1 μm diameter bead through a λ-DNA. Force was applied by translating the microscope stage at a speed of 455 nm s−1. FRET was measured between Cy3 (donor) and Cy5 (acceptor) as a function of force. b A representative time trace of E and the applied force from a single-molecule of Spinach2 over two pulling cycles (20 ms integration time). The black and red arrows represent E steps during stretching and relaxation, respectively. The orange arrow denotes photobleaching of the fluorescent dyes. A blown-up image of cycle 1 is shown in the inset. c Average E vs force response from molecules undergoing stretching (top) and relaxation (bottom). The errors represent standard errors. (N = 48). d Force vs E response corresponding to the steps at E1, E2, and E3 under stretching (top) and relaxation (bottom). The average force and E values are emboldened. Source data are provided as a Source Data File. e A schematic of Spinach2 molecule under tension, in the ligand-bound state. DFHBI-1T is represented as a blue sphere. The Cy5 and Cy3 dyes adjacent to A24 and A75 are shown as red and green asterisks, respectively. Force (F) applied on the construct is shown by arrows. f Average E vs force response from molecules during stretching (left) and relaxation (right) in the presence of DFHBI-1T. (N = 36). g Comparison of the average forces stretching forces corresponding to the three unfolding E states in the absence and presence of DFHBI-1T. Source data are provided as a Source Data File

