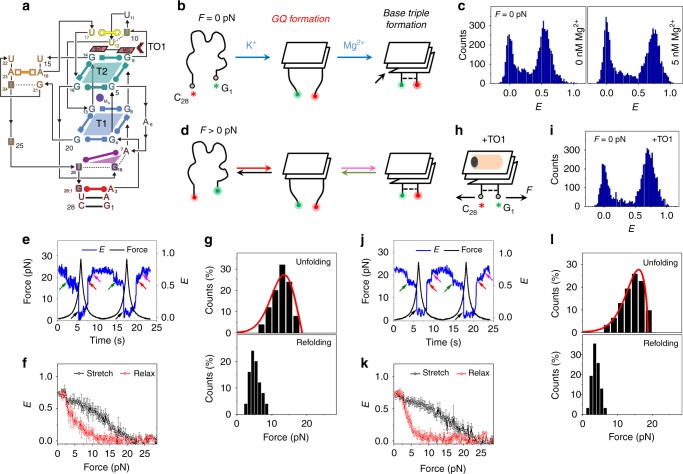
Fig. 3.
Conformational dynamics of iMangoIII. a Sequence and secondary structure of iMangoIII used in this study. T1 and T2 denote the G-quartets in iMangoIII. TO1 is indicated by the brown arrowhead51. Adapted with permission from ref. 51. b Schematic of probable sequential folding of iMangoIII GQ and the flanking base triple, in the absence of force. The structures are drawn with reference to the recently solved crystal structure51. The Cy5 and Cy3 dyes adjacent to C28 and G1 are shown as red and green asterisks, respectively. c E histograms of iMangoIII in a buffer containing 100 mM K+, with (right) and without (left) Mg2+, in the absence of force. d Schematic of unfolding (green and black) and refolding (red and magenta) transitions of iMangoIII, under an applied force. Green and magenta arrows respectively indicate unfolding and refolding of the base triple. Black and red arrows indicate unfolding and refolding of the GQ core, respectively. e A representative smFRET time trajectory over two pulling cycles. Unfolding and refolding transitions at ~2.5 pN are indicated by green (stretch) and magenta (relax) arrows. The major unfolding and refolding transitions are shown via black and red arrows, respectively. f Average E vs force response. g Distributions of unfolding and refolding forces corresponding to the black and red arrows in d. (N = 62 for both). The red curves represent force distributions estimated from the Dudko–Szabo model46,47 (top). h A schematic of TO1-iMangoIII complex under tension. TO1 is represented by the orange and black symbol. Force (F) applied on the construct is shown by arrows. i E histogram of iMangoIII under saturated concentrations of TO1, in the absence of force. j A representative smFRET time trajectory of iMangoIII in the presence of TO1. The arrow indicators used are similar to e. k Average E vs force response in TO1 containing buffer. l Distributions of unfolding and refolding forces corresponding to the black and red transitions in i and fits (red curves) predicted from models proposed by Dudko et al.46,47 (N = 50 for both). Data presented in e–l were collected in a buffer containing 100 mM K+ and 5 mM Mg2+. The time trajectories were acquired at an integration time of 20 ms. All error bars represent standard errors

