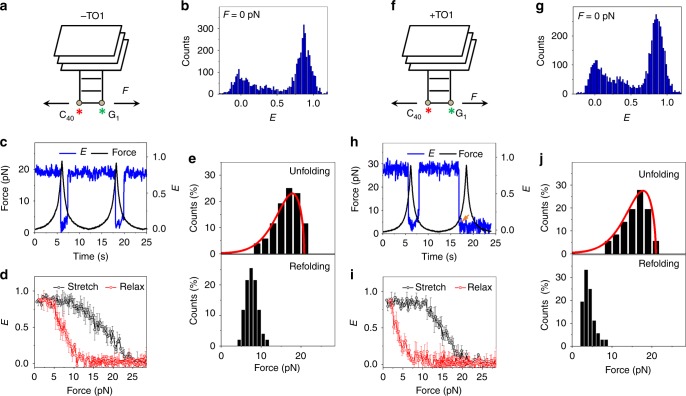
Fig. 4.
Conformational dynamics of MangoIV. a A schematic of MangoIV under tension. In view of the proposed structural similarity, the representation is constructed with reference to MangoI crystal structure9, 18. The Cy5 and Cy3 dyes adjacent to C40 and G1 are shown as red and green asterisks, respectively. To mimic the intracellular ionic conditions, all data shown in this figure were collected in a buffer containing 100 mM K+ and 1 mM Mg2+. b E histograms of MangoIV, in the absence of force. c A representative FRET time trajectory of a single molecule of MangoIV over two pulling cycles. d Average E vs force response. e Distributions of unfolding (top) and refolding forces (bottom). (N = 51 for both). f A schematic of TO1-MangoIV module under tension. Force (F) applied on the construct is shown by arrows. g E histogram of MangoIV in a buffer containing saturated concentrations of TO1, in the absence of force. h A representative smFRET time trajectory of MangoIV in the presence of TO1. The orange arrow indicates photobleaching of the dyes. i Average E vs force response in TO1 containing buffer. j Distributions of unfolding and refolding forces. (N = 36 for both). The time trajectories were acquired at an integration time of 20 ms. The red curves in e and j represent force distributions estimated from the Dudko–Szabo models46, 47. All error bars represent standard errors

