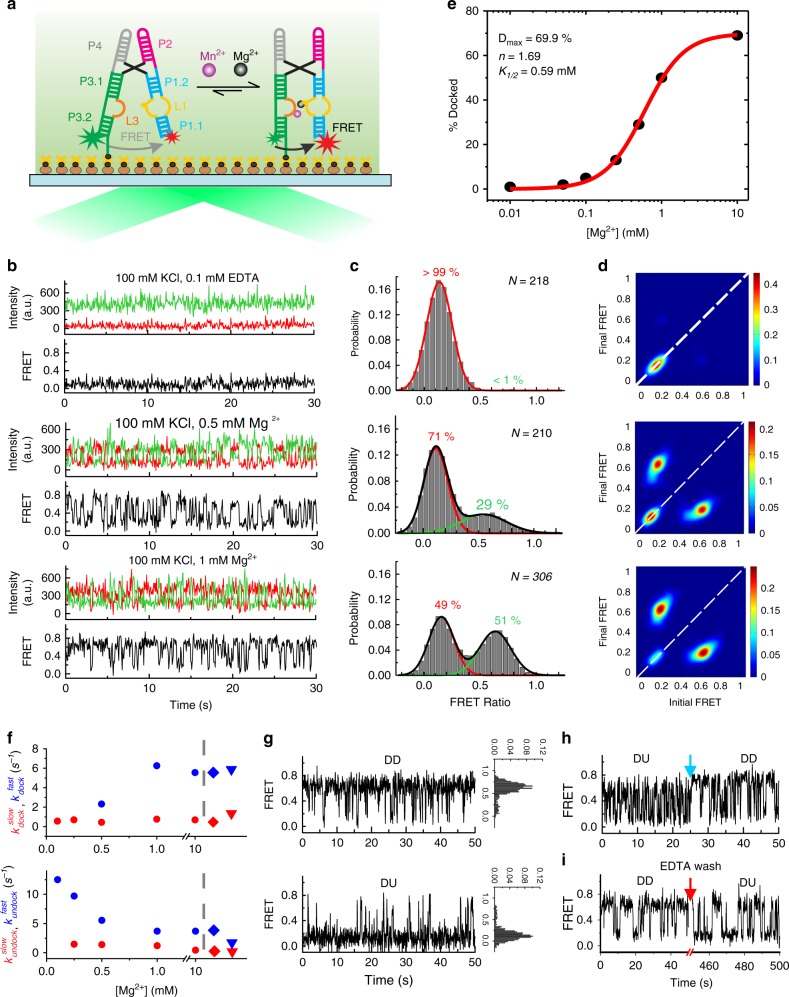
Fig. 4.
smFRET analysis of the WT Xory Mn2+ riboswitch. a Schematic of the smFRET experiment using TIRFM indicating the fluorophore labeling positions on the riboswitch. b Representative smFRET traces under different buffer conditions (top–bottom): no divalents (+0.1 mM EDTA), 0.5 mM Mg2+ and 1 mM Mg2+, respectively. Green, Cy3; Red, Cy5; Black, FRET. c Population FRET histograms showing the equilibrium distribution of two FRET states under the conditions in panel (b). Gaussian peaks for the low- and high-FRET states are shown in red and green, respectively with the cumulative fit shown in black. Reported are the percentages of FRET states at equilibrium, as well as the number of molecules N analyzed. d TODPs showing the static and dynamic trances as “on-diagonal” and “off-diagonal” heat map contours, respectively. The color code indicates the fraction of each population. e Fraction of the high-FRET state as a function of Mg2+ concentration, fit with a standard Hill equation (red). f Kinetics of structural dynamics as a function of Mg2+ and Mn2+ concentration. The diamond symbols represent rates in 1 mM Mg2+ and 0.1 mM Mn2+ while the triangle symbols represent rates in 0.1 mM Mn2+ alone. g Exemplary dynamic docked (DD, top) and dynamic undocked (DU, bottom) traces in the presence of 1 mM Mg2+. FRET histograms for the individual traces are shown on the right. h Rare examples of interconversion between different kinetic regimes showing dynamic heterogeneity. The blue arrow indicates the time of switching between the two kinetic regimes. i Exemplary trace showing conversion of a DU trace to DD trace upon chelation of Mg2+ with EDTA (indicated by the red arrow) and reintroducing 1 mM Mg2+. Source data for panels (e) and (f) are provided as a Source Data file

