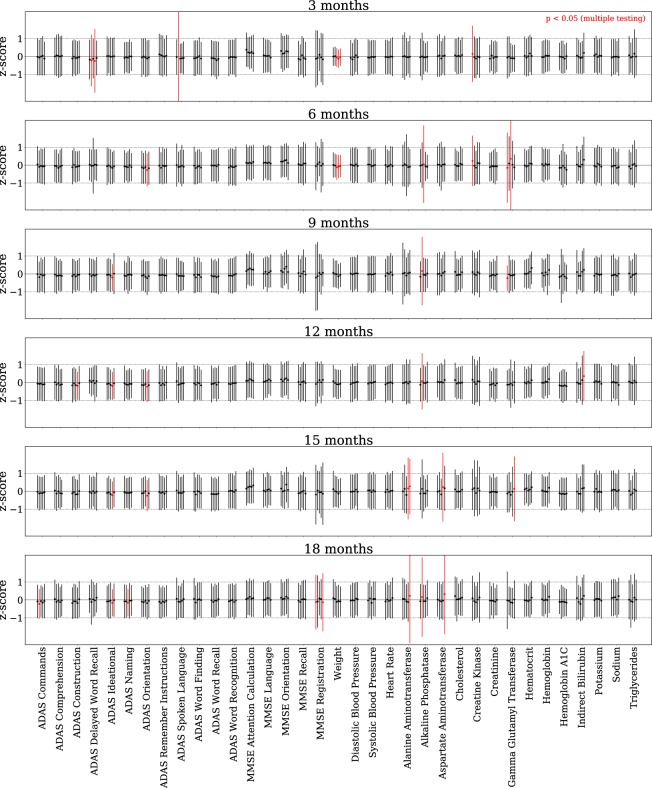
Figure 2.
The model accurately simulates individual patient trajectories. The mean and variance over all patients of the per-patient z-score distribution is shown for every time-dependent variable (except dropout) at every time point beyond baseline. Results are shown for all CV models. For each patient, the z-score is calculated from 100 simulations of that patient conditioned on the baseline data (the synthetic subjects are of type (i) described above). The first (mean) and second (standard deviation) moments of the distribution of z-scores over all patients for each variable and time point is computed and displayed with a point (mean) and error bar (standard deviation). Under the assumption that a variable is normal, this z-score distribution should be a standard normal, with mean 0 and standard deviation 1. For each variable at each time point, we use the Kolmogorov-Smirnov test to evaluate whether the mean and standard deviation of the z-score distribution are significantly different from a standard normal. Any significantly different (p < 0.05) cases remaining so after a Bonferroni correction are labeled in red.

