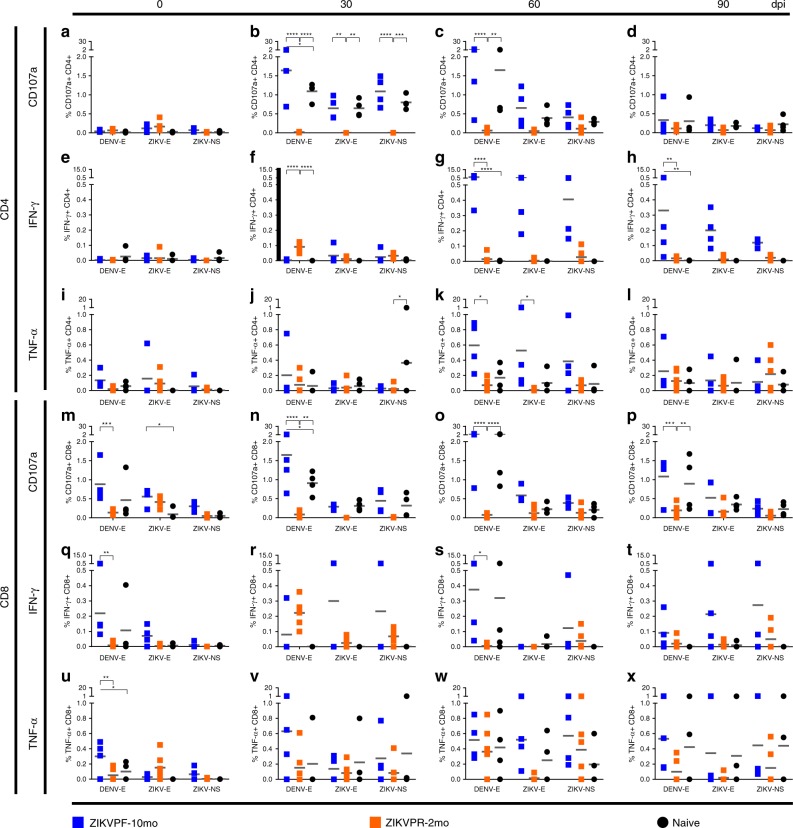
Fig. 7.
Longevity of ZIKV immunity shapes the T cell functional response. T cell functional effector response was determined by the quantification (%) of (a–d; m–p) CD107a-expressing and (e–h; q–t) IFN-γ or (i–l; u–x) TNF-α-producing CD4+ and CD8+ T cells before (0) and 30, 60, and 90 days after DENV infection. Responses to several peptide pools that encode for DENV and ZIKV envelope (E) proteins or ZIKV nonstructural (NS) protein were quantified. After antigenic stimulation, intracellular cytokine staining was performed using flow-cytometry analysis (Supplementary Fig. 14 for gating strategy). Individual symbols represent each animal per antigenic stimulation over time: blue squares (ZIKVPF-10mo), orange squares (ZIKVPR-2mo), and black circles (naive). Short gray lines mark mean value for each group. Statistically significant differences between groups were calculated using two-way ANOVA adjusted for Tukey’s multiple comparisons test including three families, and three comparisons per family. Significant multiplicity adjusted p-values (*< 0.05, **< 0.01, ***< 0.001, ****< 0.0001) are shown. Asterisks represent significant difference between indicated groups. Source data are provided as a Source Data file

