Figure 2.
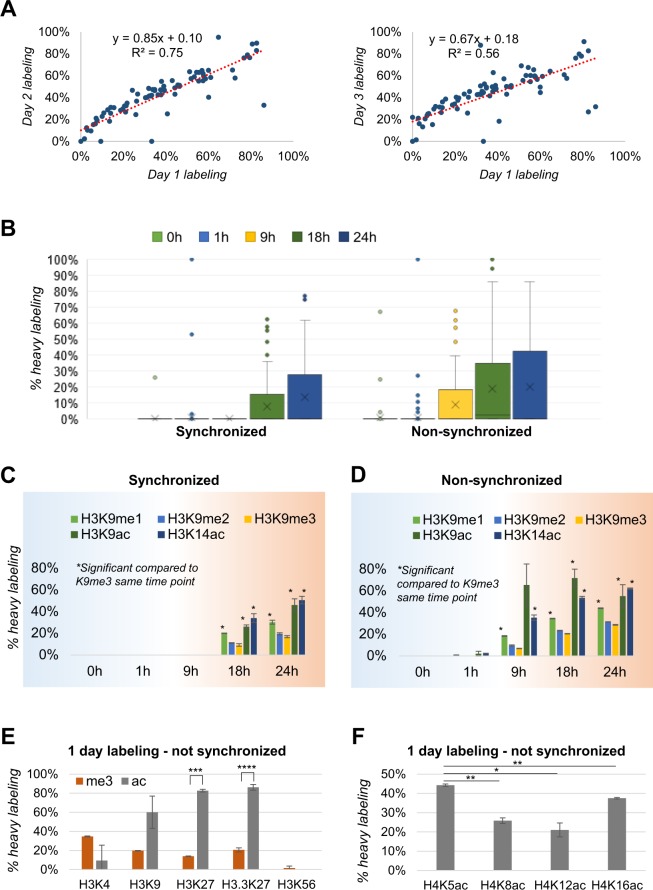
Labeling incorporation as function of time. (A) Percentage of labeling incorporation on all detectable 219 peptides after 1 day vs 2 days of growth in labeling media (left) or after 1 day vs 3 days of labeling (right) (correlation p-value 10e-26 and 10e-12, respectively). (B) Labeling incorporation on all detectable peptides represented as box plot. (C) Labeling incorporation of the peptide of histone H3 KSTGGKAPR (aa 9–17) in all its modified forms. Cells were labeled after being synchronized and (D) not synchronized. (E) Labeling incorporation of the histone H3 residues hosting the most abundant trimethyl and acetyl marks. The comparison considers only peptides modified with a single PTM; e.g. does not include hybrid modified peptides such as H3K9me3K14ac. (F) Labeling incorporation of the histone H4 peptide GKGGKGLGKGGAKR (aa 4–17) modified with a single acetylated residue. Significance represented between H4K5ac and the other marks. All significance estimations are based on a two-tail heteroscedastic t-test (significant when p-value < 0.05).

