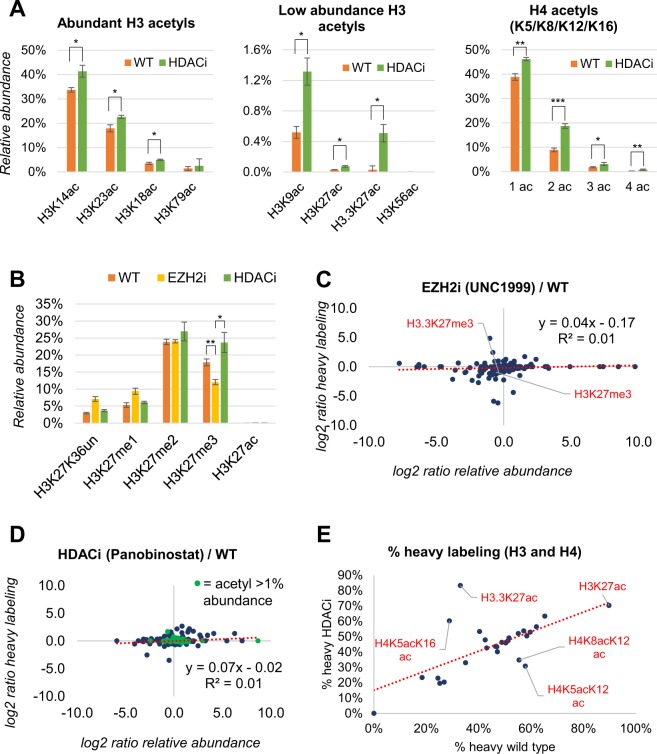
Figure 3.
Regulation of PTM relative abundance and labeling rate upon drug treatment. (A) Relative abundance of the most abundant acetylations of histone H3 and H4 in wild type and HDAC inhibitor (HDACi) treated cells. (B) Relative abundance of representative modified forms of histone H3 regulated during treatment with inhibitors. All data were extracted after 2 days of labeling. All significance estimations are based on a two-tail heteroscedastic t-test (significant when p-value < 0.05). (C) Correlation analysis of fold change regulation (not significant) of the relative abundance of histone peptides after treating cells with EZH2 inhibitor (x-axis) vs the fold change of labeling incorporation (y-axis). The y-axis shows very minor changes, indicating that the regulation of PTM abundance is independent from the labeling incorporation. (D) Same correlation analysis using the HDAC inhibitor Panobinostat (not significant). (E) Labeling incorporation of the major acetylated peptides of histone H3 and H4 in wild type and HDACi treated cells.

