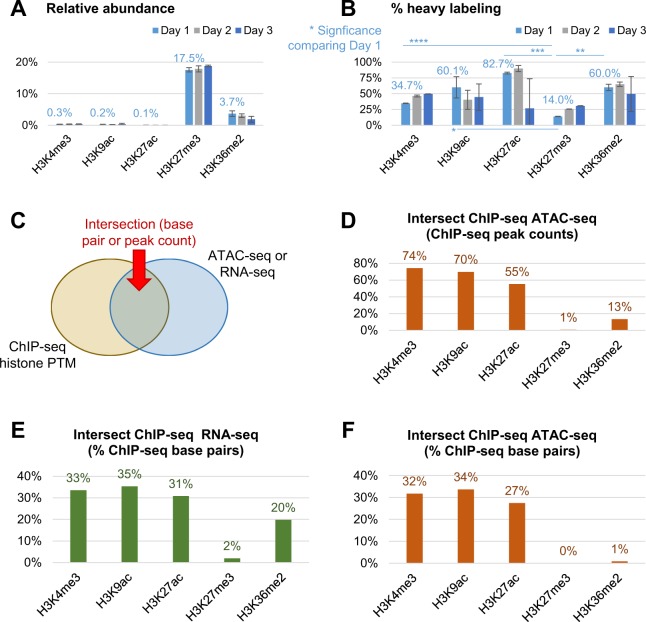
Figure 4.
Validation of the link PTM – chromatin state via genomics analysis. (A) Relative abundance of the five selected PTMs of histone H3 at day 1 to 3 of EL4 cell culture. (B) Labeling incorporation of the five representative marks. P-value is calculated by comparing H3K27me3 with the other PTMs at day 1. All significance estimations are based on a two-tail heteroscedastic t-test (significant when p-value < 0.05). (C) Description of how the following data were retrieved; panels D–F include the intersection of the reads obtained both by ChIP-seq and either ATAC-seq or RNA-seq. (D) Number of peaks intersecting in ChIP-seq and ATAC-seq data. (E) Intersection (counted base pairs) of genomics regions covered by both ChIP-seq and RNA-seq or (F) ATAC-seq.

