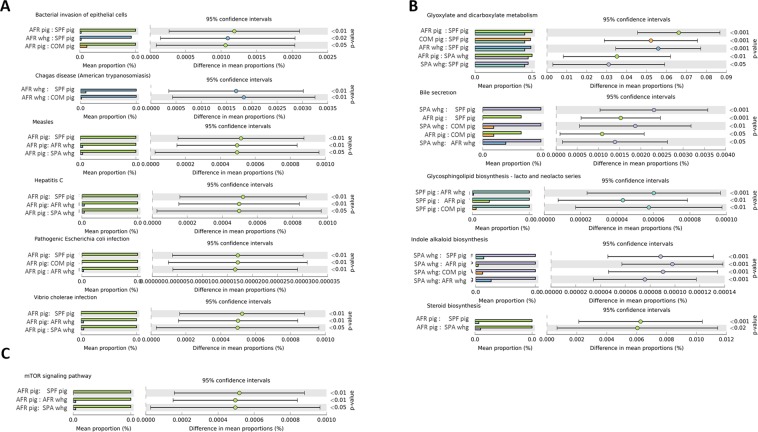
Figure 7.
Prediction of changed KEGG pathways using PICRUSt analysis. Selected pathways found to be significantly different among the different animal groups are depicted based on their relation to infection diseases (A), metabolic pathways (B) and immune response (C). Dot plots on the right show the differences in mean proportions between the two indicated groups using P values. All KEGG pathways that were significantly changed are detailed in Supplementary Table S6.

