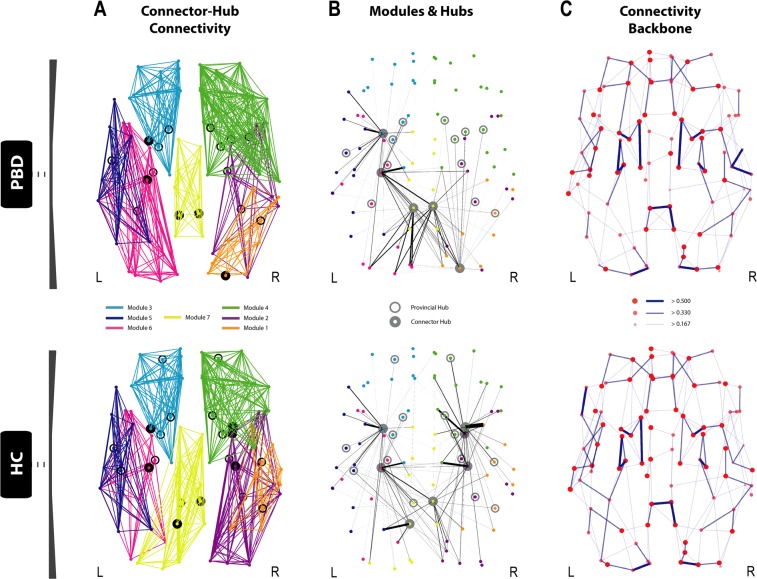
Figure 3.
Disrupted modularity, hubs and connector-hub connectivity in patients with pediatric bipolar disorder (PBD) with psychosis. The figure shows the changes in the optimal community structure, i.e. the seven modules and connector hubs shown on a dorsal view of the brain of patients with PBD (top row) and healthy controls (HC, bottom row), with node colours denoting membership to a module and with intra-module edges coloured accordingly. Connector hubs (marked as filled circles) are defined as regions with high within-module degree centrality and a participation coefficient p > 0.3, denoting a high proportion of cross-module connectivity. Provincial hubs (marked as unfilled circles) are defined as having high within-module degree centrality but participation coefficient p ≤ 0.3. (A) Dorsal view of the optimal modularity partitioning found in PBD (top), reveals a different configuration compared to HC (bottom). (B) Significant local changes are found in the undirected structural connectivity profile for the connector hubs in PBD (top) compared to HC (bottom). Edges, coloured in black, correspond to the structural connectivity of each connector hub region to any other region in the brain, with thickness proportional to its connection strength. Colour of dots represents the belonging of a brain area to a particular community, consistent with (A). Albeit the number of both provincial and connector hubs is preserved between the two groups (Supplementary Table 2), variance in the distribution reflects the high impact on the regional dispersion and density of connector-hub-connectivity (CHC), i.e. network of undirected connections involving connector hubs. Whilst there is an almost symmetric distribution of provincial and connector hubs in the HC group, asymmetries found in the hub distribution in the PBD group led to a significantly decreased CHC density in the right anterior hemisphere and a shift of the CHC towards posterior areas of the brain, as shown in (B). Notably, the connection between the orbitofrontal provincial hub and the amygdala connector hub is missing in the patient group. (C) Dorsal view of the brain connectivity backbone for patients with PBD with psychosis (top), and HC (bottom). Nodes and edges are coded according to normalised degree and connection weight respectively. Diameter, thickness and transparency of nodes and edges are divided into three weight levels (see legend).

