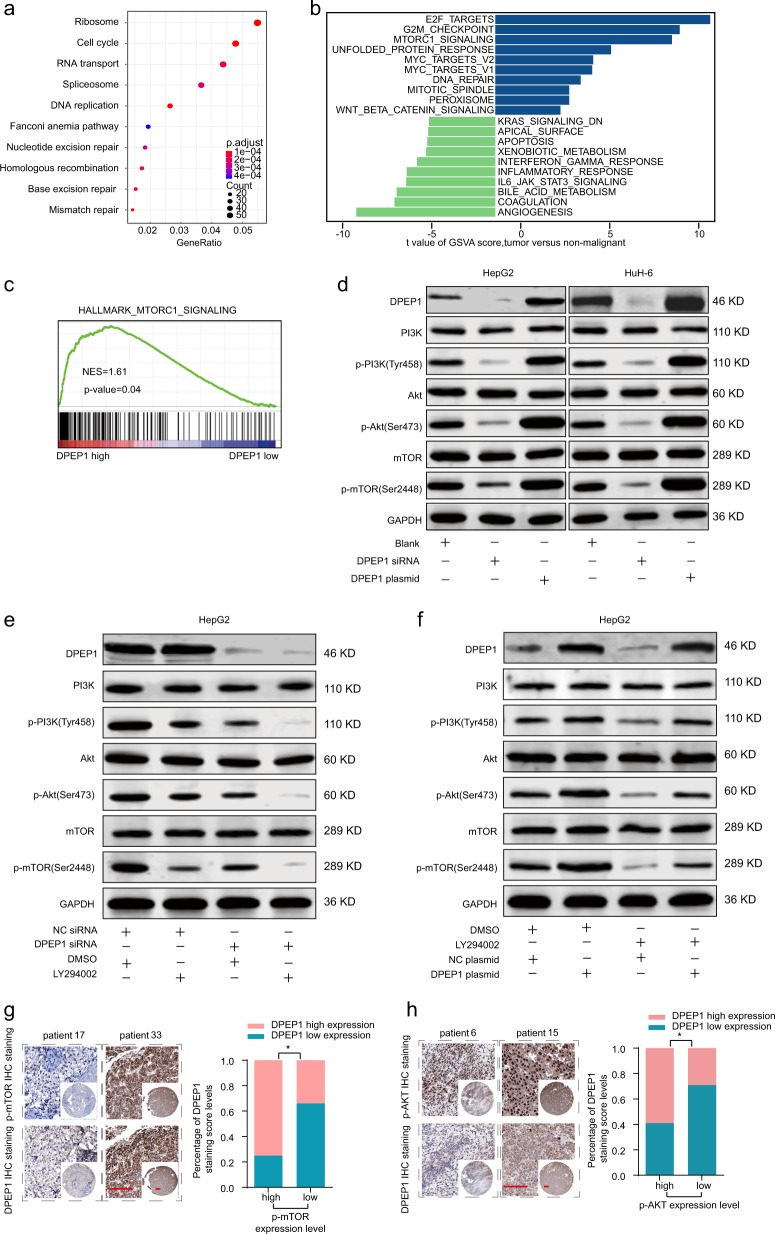
Fig. 4. Functional and pathway enrichment analysis of DPEP1 and DPEP1 activates PI3K/Akt/mTOR signaling in HB.
a KEGG enrichment analysis disclosed several enrichment pathways in HB cohort. b Gene set variation analysis (GSVA) comparison of signaling pathways with differentially expressed genes between DPEP1 high expression and low expression groups. c GSEA analysis the enrichment of mTORC1 signaling DPEP1 high expression and low expression groups. d Expression levels of PI3K, p-PI3K (Tyr458), Akt, p-Akt (Ser473), mTOR, and p-mTOR (Ser2448) in HepG2 and HuH-6 transfected with DPEP1, DPEP1 siRNA, or cells only (Blank) were analyzed by western blot. e Expression levels of PI3K, p-PI3K (Tyr458), Akt, p-Akt (Ser473), mTOR, and p-mTOR (Ser2448) in HepG2 transfected with DPEP1 siRNA, NC siRNA, LY294002, or DMSO were analyzed by western blot. f Expression levels of PI3K, p-PI3K (Tyr458), Akt, p-Akt (Ser473), mTOR, and p-mTOR (Ser2448) in HepG2 transfected with DPEP1 plasmid, NC plasmid, LY294002, or DMSO were analyzed by western blot. The representative result of at least three independent experiments was shown. g Representative IHC staining of DPEP1 and mTOR in HB tissues from ZZU cohort. Scale bars, 50 μm. *P < 0.05. h Representative IHC staining of DPEP1 and Akt in HB tissues from ZZU cohort. Scale bars, 50 μm. *P < 0.05

