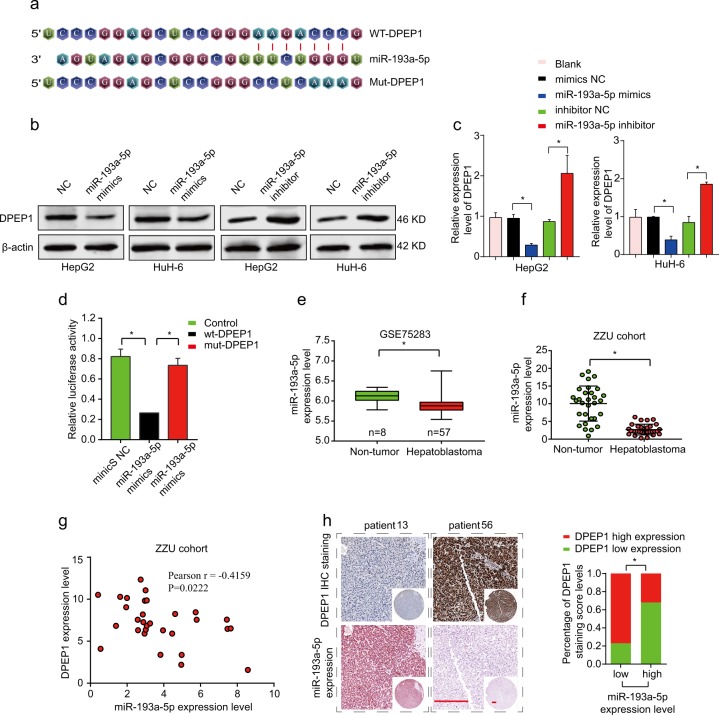
Fig. 5. DPEP1 is a direct target of miR-193a-5p.
a Diagram of the potential binding sequences of miR-193a-5p on the 3′-UTR of DPEP1 and the mutated sequences of DPEP1 3′-UTR. b, c Western blot (b) and qRT-PCR analysis (c) the protein and mRNA expression levels of DPEP1 in HepG2 or HuH-6 cells transfected with miR-193a-5p mimics, miR-193a-5p inhibitor, or negative control (NC). d WT 3′-UTR or mutated 3′-UTR of DPEP1 was constructed into luciferase reporter vector and co-transfected with miR-193a-5p mimics into HEK293 cells. Relative luciferase activity was assessed 48 h after transfection. e, f The expression levels of miR-193a-5p in GEO database GSE75283 and ZZU cohorts. g Pearson’s correlation analysis of the relationship between DPEP1 expression level and miR-193a-5p expression level in ZZU cohort. h Representative IHC staining of DPEP1 and miR-193a-5p in HB tissues from ZZU cohort (left panel) and quantification of DPEP1 staining scores in HB patients from ZZU cohort with high or low miR-193a-5p expression. Scale bars, 50 μm. *P < 0.05

