Fig. 2.
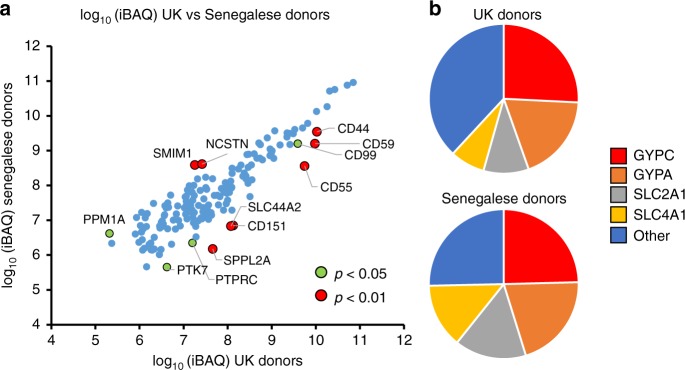
Comparison of RBC surface protein abundance between populations. a iBAQ abundance values for each protein from all nine UK and all nine Senegalese donors. Data are shown where iBAQ values were available from both populations, for the ‘sensitive’ list of RBC surface proteins with likely serum contaminants removed. Significance A values were used to estimate p-values for ratio of iBAQ abundances for each protein as described in ‘Methods’. b iBAQ abundances of GYPA, GYPC, SLC2A1 and SLC4A1 as a proportion of the total RBC surface proteome

