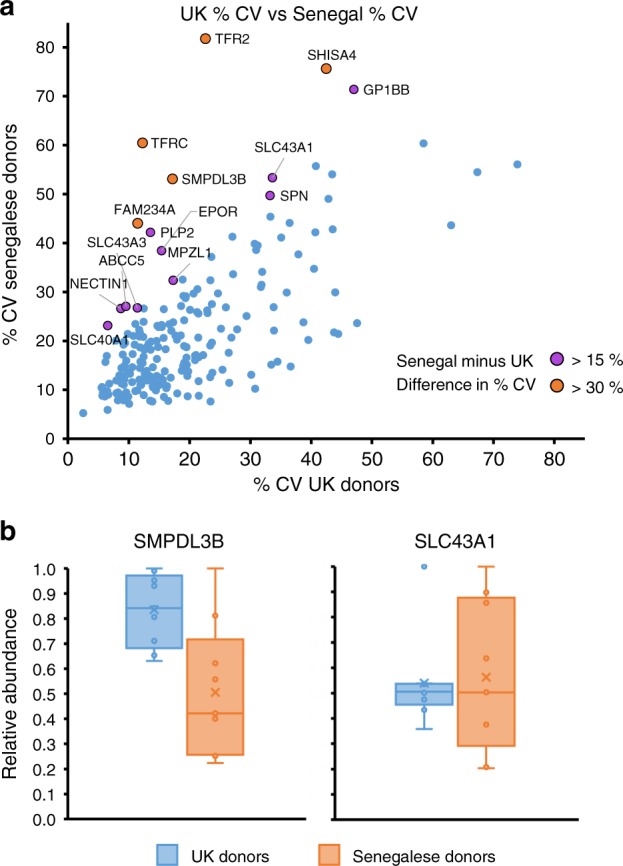
Fig. 3.

Comparison of variability in RBC surface protein expression between populations. a Coefficients of variation for each protein identified by ‘sensitive’ criteria and quantified in both populations. Leukocyte-derived contaminants HLA-A, B and C as well as the X-linked glycoprotein XG exhibited >80% CV and are not shown on this plot to enable easier visualisation of proteins with 0–80% CV. Increased variation was exhibited by some proteins from Senegalese populations, shown in green and red as indicated in the legend. b The relative abundance of SMPDL3B and SLC43A1 from each donor in both populations, normalised to a maximum of 1, plotted as a box and whisker plot showing mean, median and interquartile ranges. n = 9 biologically independent samples for each group
