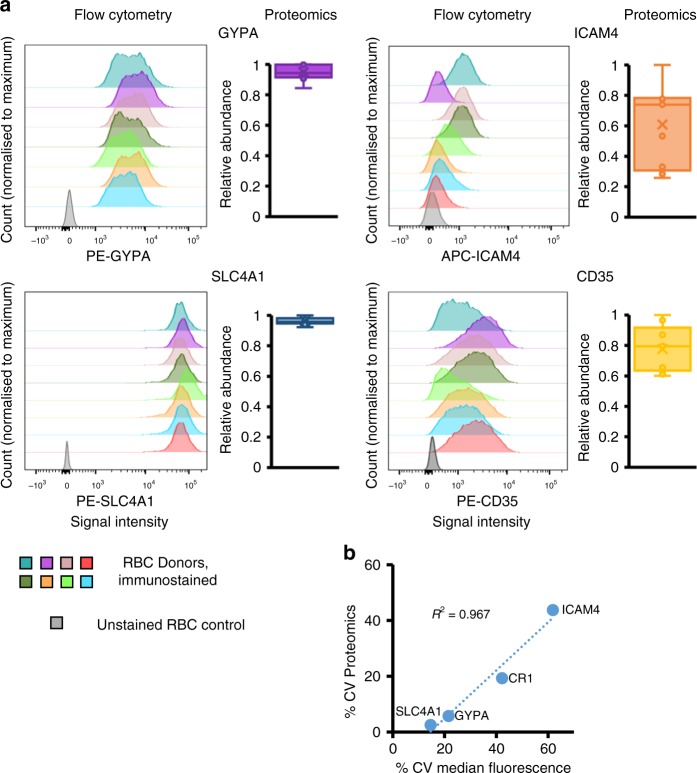
Fig. 4.
Validation of proteomic assessment of expression of cell surface proteins by flow cytometry. a Variability of expression of RBC surface proteins from an independent set of UK donors assessed by flow cytometry. Fluorescent signal intensity is shown on the x-axis, and normalised count on the y-axis. Relative abundance of the same four surface proteins as determined by proteomics from the original set of nine UK donors is plotted as an adjacent box and whisker plot showing mean, median and interquartile ranges, normalised to the maximum for each sample. b Comparison of %CV values from proteomics with %CV of the median fluorescence intensity from flow cytometry for all four RBC surface proteins (n for flow cytometry = 7 or 8, n for proteomics = 9)

