Fig. 6.
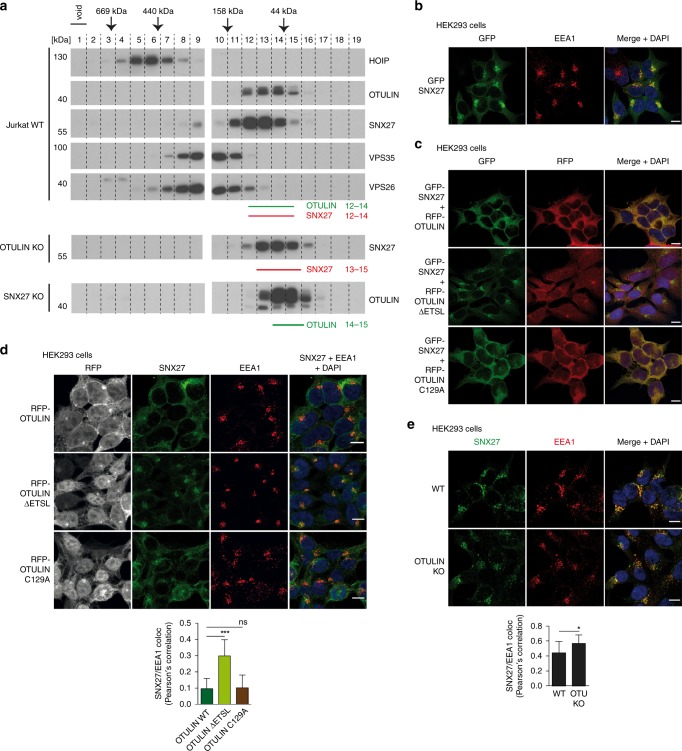
Binding of OTULIN antagonizes SNX27 association with early endosomes. a Co-elution of endogenous OTULIN and SNX27 was analyzed by size exclusion chromatography. Upper panels: cell lysates of parental Jurkat T cells were fractionated using a Superdex 200 column and elution profiles of endogenous proteins (OTULIN, SNX27, HOIP, VPS35, and VPS26) were determined by WB. Lower panels: determination of elution profiles of endogenous SNX27 and OTULIN in OTULIN and SNX27 KO Jurkat T cells, respectively. Peak elution of molecular weight standards is depicted at the top. b HEK293 cells virally transduced with GFP-SNX27 (green) were stained for early endosomes using anti-EEA1 antibody (red) and co-localization was analyzed by confocal microscopy. c HEK293 cells were co-transduced with GFP-SNX27 (green) and RFP-OTULIN WT, ΔETSL or C129A (red). Localization of proteins was analyzed by confocal fluorescence microscopy. d HEK293 cells virally transduced with RFP-OTULIN WT, ΔETSL or C129A (gray) were stained for endogenous SNX27 (green) and EEA1 (red) and localization was analyzed by confocal fluorescence microscopy. e WT or OTULIN KO HEK293 cells were stained for endogenous SNX27 (green) and EEA1 (red) and localization was analyzed by confocal fluorescence microscopy. Co-localization in d and e was quantified by determining Pearson’s correlation using at least 12 pictures and imaging more than 100 cells for each condition. Graphs depict the mean ± SD. Two-tailed p-values: ns not significant, *p ≤ 0.05, ***p ≤ 0.001 by unpaired t-test. Scale bars: 10 µm. Source data are provided as a Source Data file

