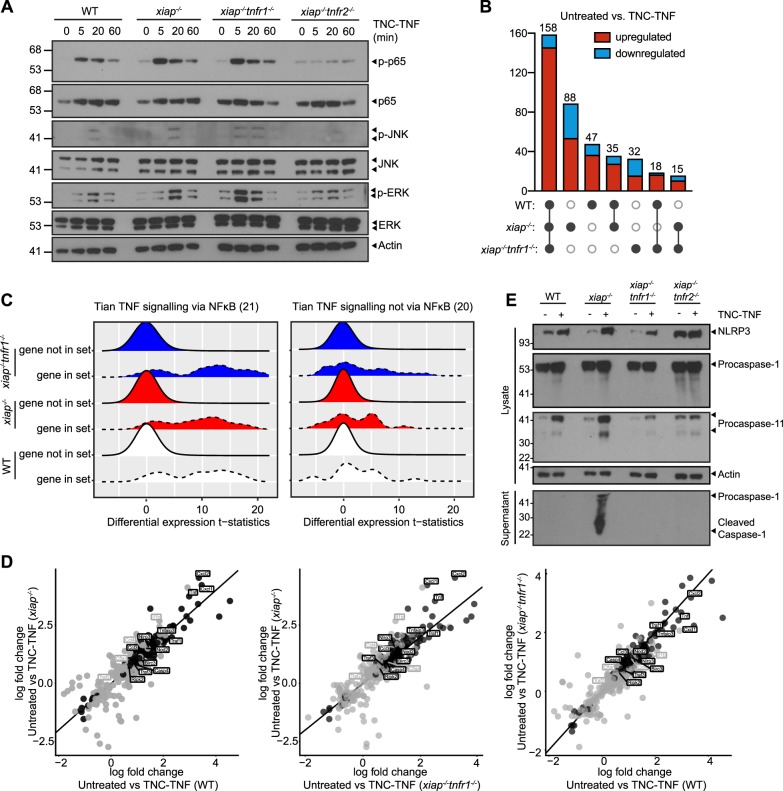
Fig. 4. TNFR2 primes inflammasome components.
a BMDMs were treated with TNC-TNF for the indicated time points and expression levels of proteins of the NF-κB and MAPK signaling pathway were analysed by western blotting. Blots are representative of three independent repeats. b Upset plot representing the detected changes in expression between untreated and TNC-TNF treated for each of the genotypes, including up- and downregulated genes. c Gene set analysis of Tian TNF signalling via NF-κB or not via NF-κB (number of genes in the gene set are given in parentheses). The distributions of differential expression t-statistics (computed by voom) are shown for the genes within the gene set and not within the gene set for each genotype. d Comparison of differentially regulated genes in WT, xiap−/− and xiap−/−tnfr1−/− macrophages after TNC-TNF treatment. Black dots represent genes that are differential at FDR < 0.05 in all three genotypes, and grey dots represent genes that are differential at FDR < 0.05 in two genotypes. e Representative western blot showing TNC-TNF treatment leads to upregulation of NLRP3, caspase-11 and pro-caspase-1, but only in xiap−/− macrophages is caspase-1 cleavage detected. Blots are representative of three independent experiments.

