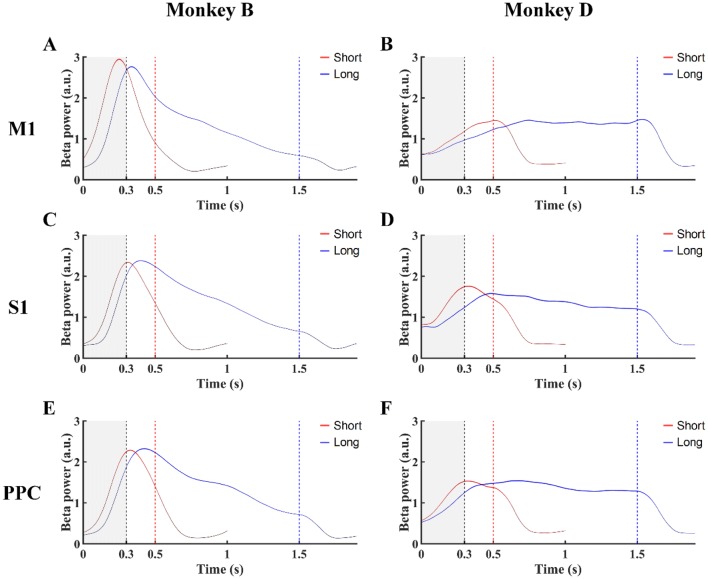
Fig. 3.
Beta power changes over time in M1, S1, and PPC for Monkey B (A, C, E) and Monkey D (B, D, F) in the fixed-duration mode. Red lines, Short Group tasks; blue lines, Long Group tasks; black dashed lines, end of the 300-ms window (gray) from CH (0 on x axis); red and blue dashed lines, onset times of TO for the Short Group, and Long Group, respectively.

