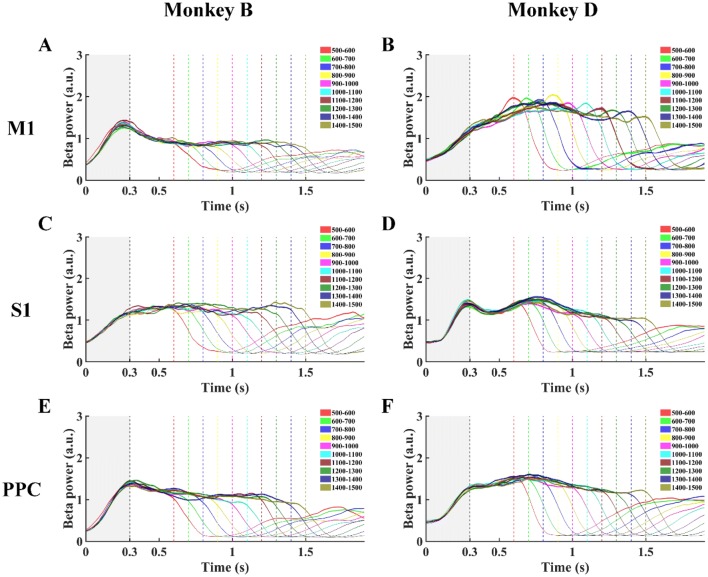
Fig. 4.
Beta power changes over time in M1, S1, and PPC for Monkey B (A, C, E) and Monkey D (B, D, F) in the random-duration mode. Power changes of ten groups with different hold durations are shown. Dashed vertical lines from left to right are end of the 300-ms window (gray) from CH (0 on x axis) and each of ten Target On events.

