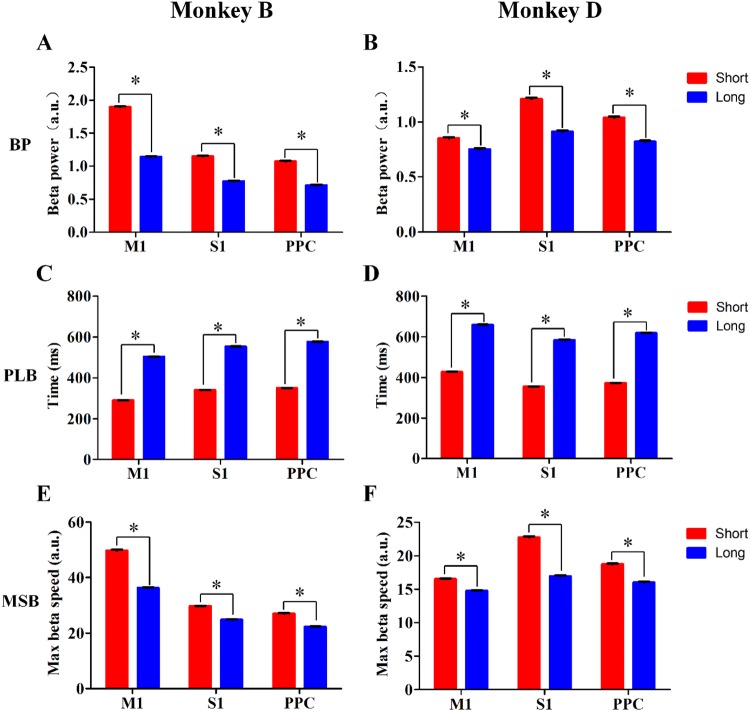
Fig. 6.
Beta power modulation in M1, S1, and PPC in the fixed-duration experiments. Mean beta power during the first 300-ms window (BP), peak latency of maximum beta power during the holding period (PLB), and maximum rate of change of beta power during the first 300-ms window (MSB) in the Short Group (red bars) and the Long Group (blue bars) in Monkey B (A, C, E) and Monkey D (B, D, F). *P < 0.05, Mann–Whiney U test.

