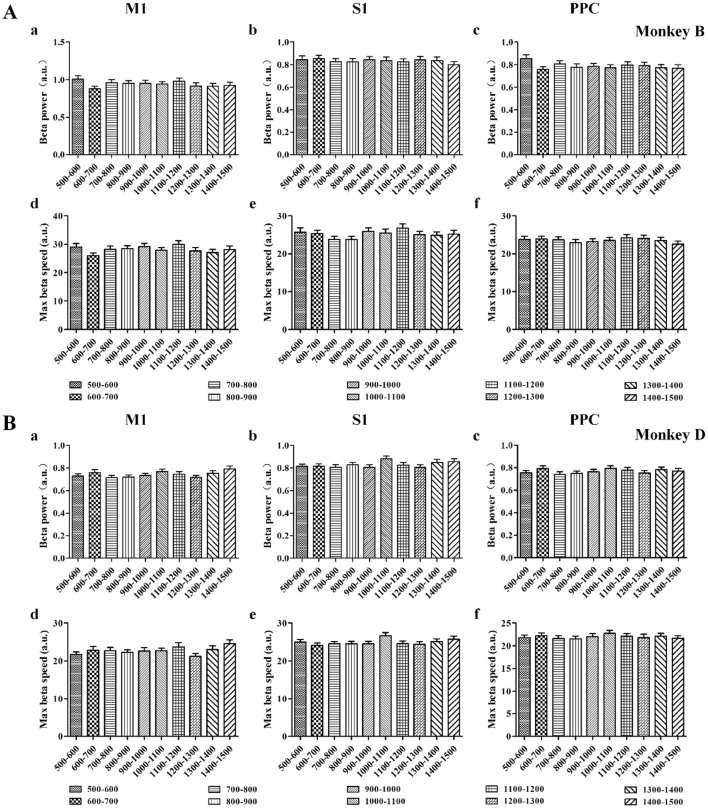
Fig. 7.
Beta power modulation of BP (a–c) and MSB (d–f) in M1 (left column), S1 (middle column), and PPC (right column) for Monkey B (A) and Monkey D (B). Values for ten groups are aligned from left to right (mean ± SD). BP and MSB both showed no statistical difference between groups for different brain areas (P > 0.05, one-way ANOVA).

