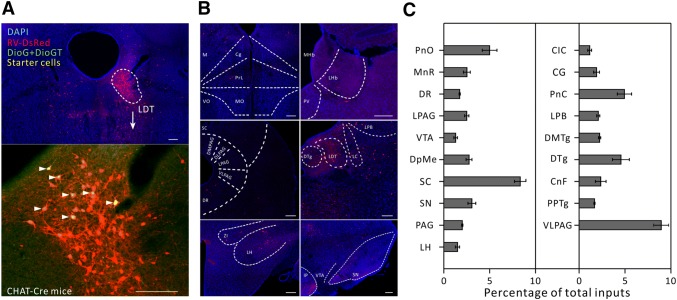
Fig. 3.
Major long-range inputs to cholinergic LDT neurons. A Representative confocal images of RV-labeled LDT neurons (red) in CHAT-IRES-CRE mice (upper panel) and starter cells (yellow, arrowheads) restricted to the LDT (lower panel). Scale bars, 150 μm. B Representative images of RV-labeled input neurons to cholinergic LDT neurons from selected brain regions. Scale bars, 150 μm. C Whole-brain distributions of afferent intensity to cholinergic LDT neurons (n = 4, mean ± SEM).

