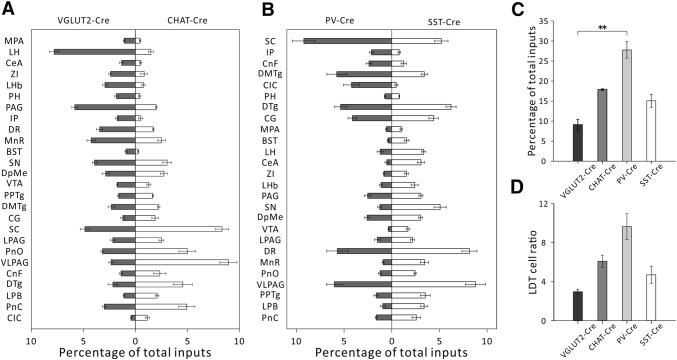
Fig. 8.
Comparison of the afferent intensity of different nuclei between different cell types and the local LDT inputs to different cell types. A Comparison of the afferent intensity from different nuclei in VGLUT2-IRES-CRE mice and CHAT-IRES-CRE mice. B Comparison of the afferent intensity in PV-IRES-Cre mice and SST-IRES-Cre mice. C Local LDT afferent intensity in the four cell types. We used the fraction input cell counts in the LDT/whole brain input cell counts to measure the afferent intensity (n = 4, **P < 0.01, mean ± SEM). D Ratios of all input cell counts of the LDT to starter cell counts (n = 4, P = 0.092, mean ± SEM).

