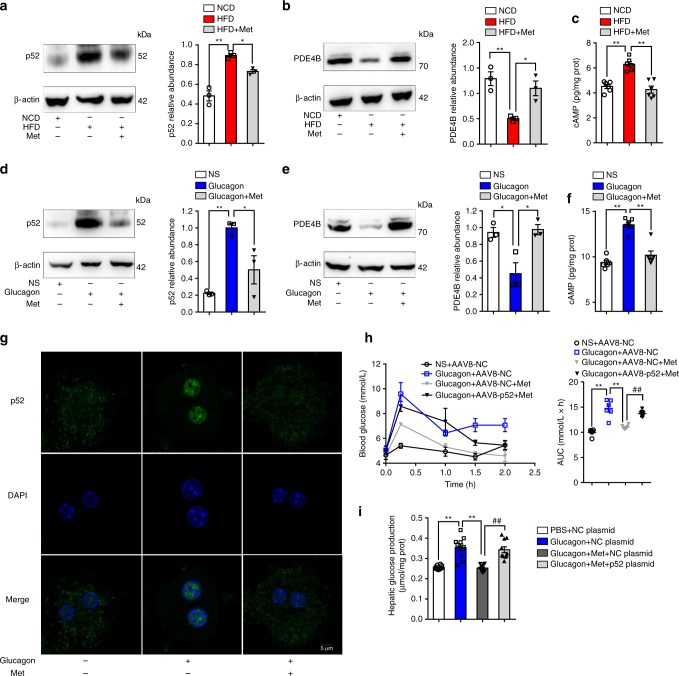
Fig. 5.
Metformin alleviates hyperglycemia by inhibiting p52 activation. a, b Western blotting analysis of p52 (a) and PDE4B (b) using liver lysates of mice fed with the indicated diet for 8 weeks. Each lane represents a liver lysate from a different animal. Bar graphs represent the data normalized to β-actin (n = 3). Metformin (200 mg/kg/d) was administrated by gavage for 8 weeks. c The cAMP levels in the liver of NCD-fed or HFD-fed mice (n = 6). d, e Western blotting analysis of hepatic p52 (d) and PDE4B (e) in mice injected with 2 mg/kg glucagon (n = 3). In total, 200 mg/kg metformin was pre-administrated by gavage 1 h before glucagon injection. f Hepatic cAMP levels in glucagon-injected mice (n = 6). g Representative confocal images of primary hepatocytes exposed to glucagon (100 nM, 1 h) pretreated with metformin (1 mM, for 4 h), or PBS. Scale bar represents 5 μm. h Blood glucose curve and AUC for mice that are either treated with AAV8-p52 or AAV8-NC after glucagon injection (n = 6). Metformin (200 mg/kg) or normal saline was administrated 1 h before glucagon injection by gavage. i Hepatic glucose production in p52 overexpression primary hepatocytes treated with or without 1 mM metformin (n = 8). HFD high-fat diet, Met metformin, PDE phosphodiesterase, NCD normal chow diet, NS normal saline, PBS phosphate buffer saline, AUC area under the curve, DAPI 4’,6-diamidino-2-phenylindole, AAV adeno-associated virus. Bars represent mean ± SEM values. Statistical differences were determined by one-way ANOVA. *p < 0.05 vs. the control group, **p < 0.01 vs. the control group. ##p < 0.01 vs. AAV8-p52 or p52 plasmid group. Source data are provided as a Source Data file

