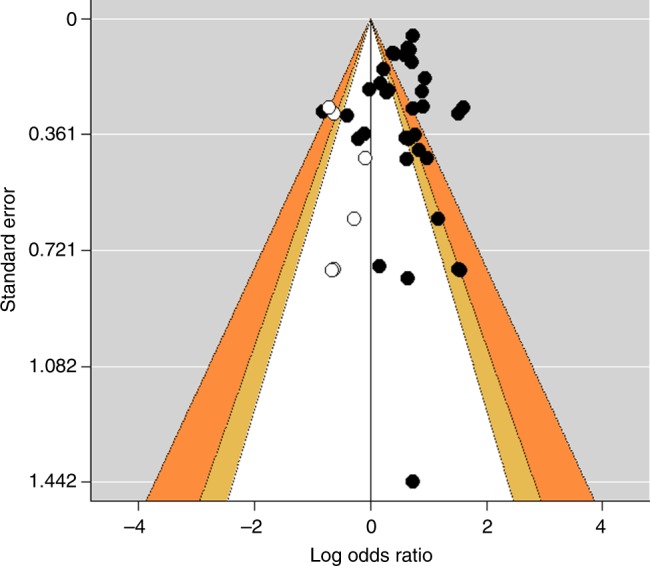
Fig. 3.

Funnel plot for the regional meta-analysis. A plot of the logarithmic risk estimates vs. the precision (standard error) for each study, with adjustment using the trim and fill method. Closed circles denote identified studies and their summary measures, respectively. Open circles represent missing studies after adjustment for funnel plot asymmetry and the summary measure incorporating hypothetical studies, respectively. Key areas of statistical significance have been superimposed on the funnel, and the plot is now centred at zero. The yellow zones show effects between p = 0.10 and p = 0.05, and the orange zones show effects between p = 0.05 and p = 0.01. Effects in the white zone are greater than p = 0.10 and effects in the grey zones are smaller than p = 0.01. A Z-test was conducted to calculate p-values
