
Figure 1). Ag-specific CD8 T cell motility in the small intestine varies during LCMV infection.
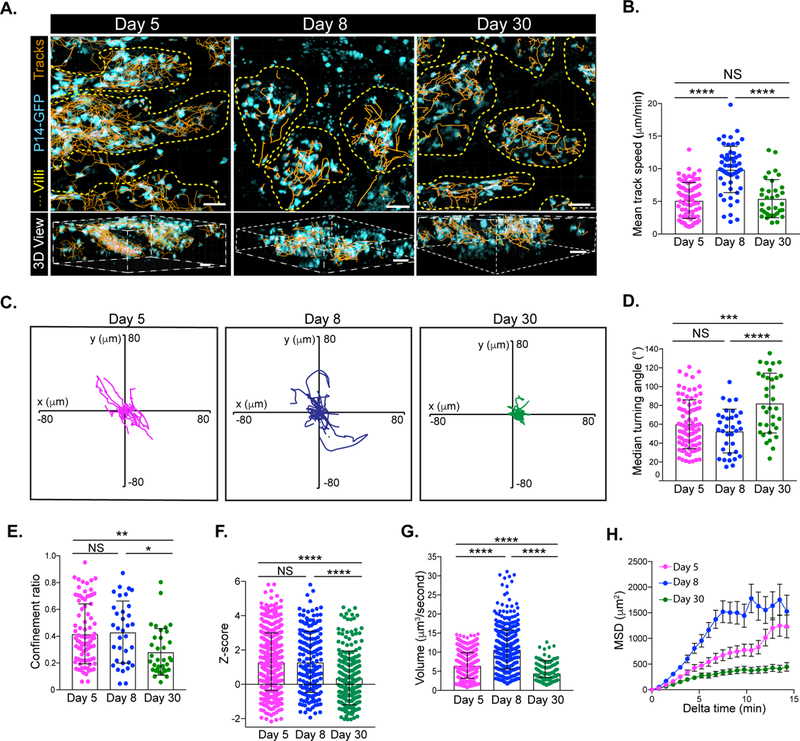
Naïve P14-GFP CD8 T cells were transferred to B6 mice and infected with LCMV. (A) Cell tracks (orange) of P14-GFP CD8 T cells (cyan) in the villi (outlined in yellow dashed lines) of the jejunum at the indicated time points after LCMV infection in orthogonal (top) or perspective (bottom) presentation. Scale bar is 20μm (top) and 30μm (bottom). (B) Mean track speed, (C) flower plots of cell track displacements, (D) median turning angle, (E) confinement ratio, (F) Z-straightness, (G) volume scanned and (H) mean squared displacement (MSD) as a function of time of P14-GFP CD8 T cells in the villi at days 5 (magenta), 8 (blue), and 30 (green) after LCMV infection. Dots in motility graphs represent individual cells imaged. Data of motility parameters presented in bar graphs are derived from the same mouse at the time point indicated. Data are representative of 2 or more experiments with mice totaling n=4 for day 5, n=7 for day 8, and n=8 for day 30. A one-way ANOVA with Dunn’s multiple comparison test was performed to evaluate statistical significance. ****p=<0.0001, ***p=<0.0003, **p=0.006, and *p=0.01. All error bars are SD. See also Figure S1.