
Figure 3). Tissue architecture dictates CD8 T cell motility in the small intestine.
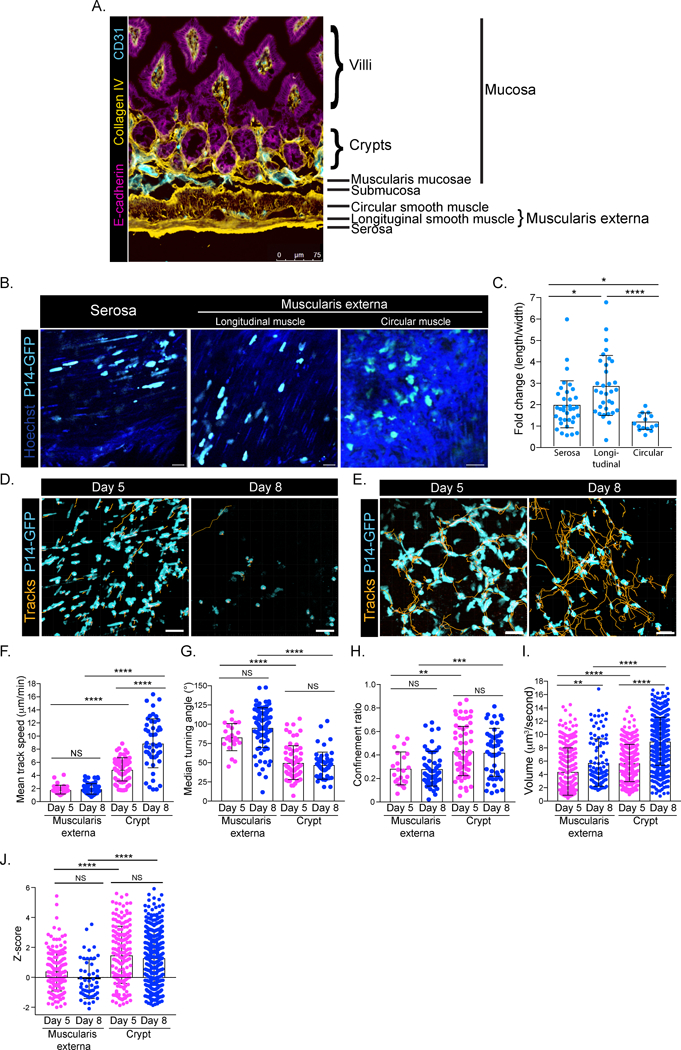
(A) Histological section of SI jejunum stained with E-cadherin (magenta), collagen IV (yellow) and CD31 (cyan). Scale bar is 75μm. (B) P14-GFP CD8 T cells were transferred to B6 and infected with LCMV. Five days post infection, P14-GFP CD8 T cells (cyan) in the serosa and muscularis externa were imaged using TPLSM. Hoechst stain (dark blue) was injected prior to imaging. (C) Fold change of length/width measurements of individual P14-GFP CD8 T cells in the serosa, longitudinal muscle and circular muscle at day 5 after LCMV. (D) Cell tracks (orange) of P14-GFP CD8 T cells (cyan) in the muscularis externa and serosa at days 5 and 8 after LCMV infection. (E) Same as in D, but in crypts of SI. Scale bars in B, D, E are 20μm. (F) Mean track speed, (G) median turning angle, (H) confinement ratio, (I) volume scanned and (J) Z-score of P14-GFP CD8 T cells at days 5 (magenta) and 8 (blue) after LCMV infection in the indicated locations of the SI. Dots in motility graphs represent individual cells imaged. Data of motility parameters for each specific experiment presented in bar graphs are derived from the same mouse at the time point indicated. Data are representative of at least 2 experiments with mice totaling n=4 for day 5 and n=5 for day 8 in the muscularis externa and n=5 for day 5 and n=7 for day 8 in the crypt. A Kruskal-Wallis one-way ANOVA with Dunn’s multiple comparison test was performed to evaluate statistical significance. ****p=<0.0001, ***p=0.0003 **p=<0.003 and *p=<0.05. All error bars are SD.