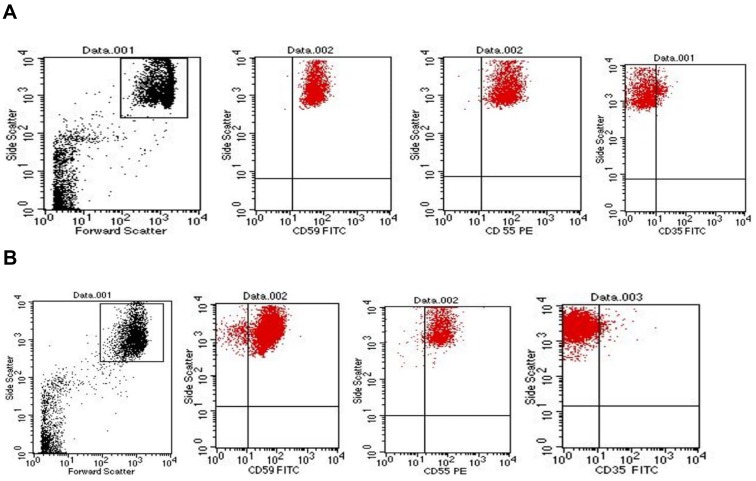
Figure 1.
Representative dot plot showing red blood cells (RBCs) distribution and gating by forward scatter/side scatter characteristics. (A) Dot plots showing the expression of CD59, CD55 and CD35 on the gated RBCs of healthy controls. (B) Dot plots showing the expression of CD59, CD55 and CD35 on the gated RBCs of chronic kidney disease patients.

