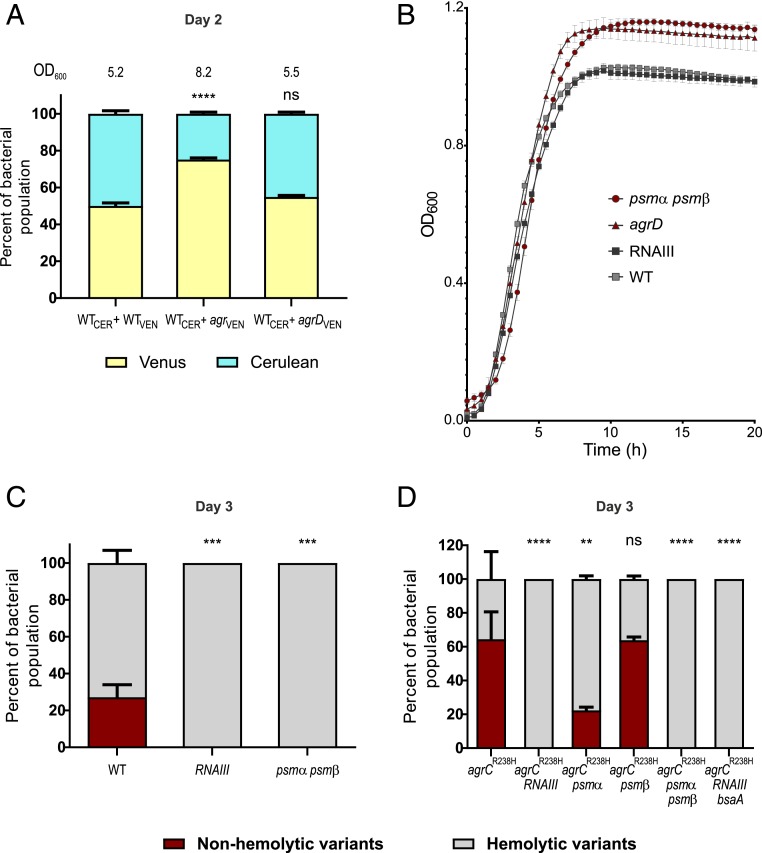
Fig. 3.
Fitness cost associated with the various nodes of the Agr system. (A) HG001 bearing PsarA-Cerulean was competed for 2 d with either agr or agrD bearing PsarA-Venus, starting at a ratio of 1:1. The final bacterial yield in each culture (OD600) is indicated. Percentage of each bacterial subpopulation was measured based on fluorescence. Error bars indicate SEM (n = 3). Statistical significance determined by one-way ANOVA with Tukey’s posttest. Asterisks indicate statistical significance in comparison to the WT population (WTCER + WTVEN). (B) Aerobic growth of HG001, RNAIII, agrD, and psmα psmβ in TSB. Error bars represent SD (n = 3). (C) HG001, RNAIII, and psmα psmβ evolved for 3 d. Error bars indicate SEM (n = 5). Asterisks indicate statistical significance in comparison to the WT. (D) HG001 agrCR238H, agrCR238H RNAIII, agrCR238H psmα, agrCR238H psmβ, agrCR238H psmα psmβ, and agrCR238H RNAIII bsaA evolved for 3 d. Error bars indicate SEM (n = 3). Asterisks indicate statistical significance in comparison to HG001 agrCR238H. (C and D) Percentage of nonhemolytic and hemolytic subpopulations was determined based on colony phenotype on blood agar. Statistical significance determined by two-way ANOVA with Tukey’s posttest. *P ≤ 0.05, **P ≤ 0.01, ***P ≤ 0.001, and ****P ≤ 0.0001.

