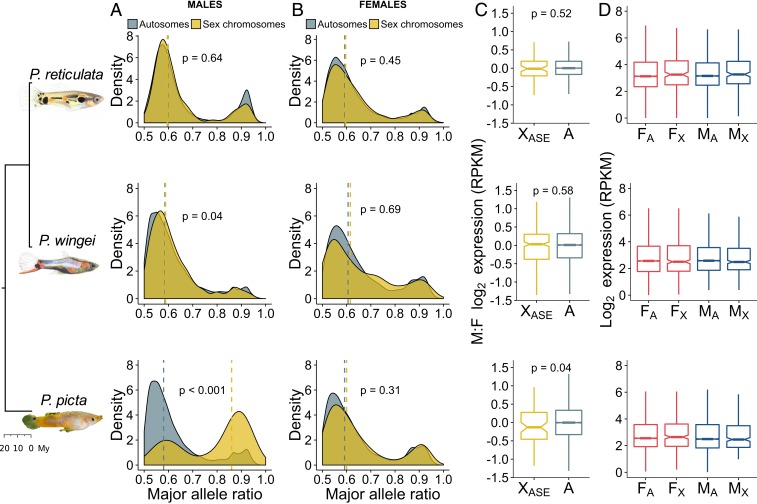
Fig. 3.
Patterns of gene expression and ASE. Density plots show the distribution of the major allele frequency of autosomal (gray) and sex chromosome (yellow) genes in males (A) and females (B) of each species. Vertical dotted lines indicate median values, and P values are based on Wilcoxon rank sum tests. (C) Boxplots show differences in log2 expression between the sexes (male/female) for autosomal genes (gray) and sex chromosome genes with an ASE pattern in males (yellow). P values are based on Wilcoxon rank sum tests. (D) Boxplots show average male (blue) and female (red) log2 expression for autosomes (A) and the nonrecombining region of the sex chromosomes (X) in each species. F, female; M, male.

