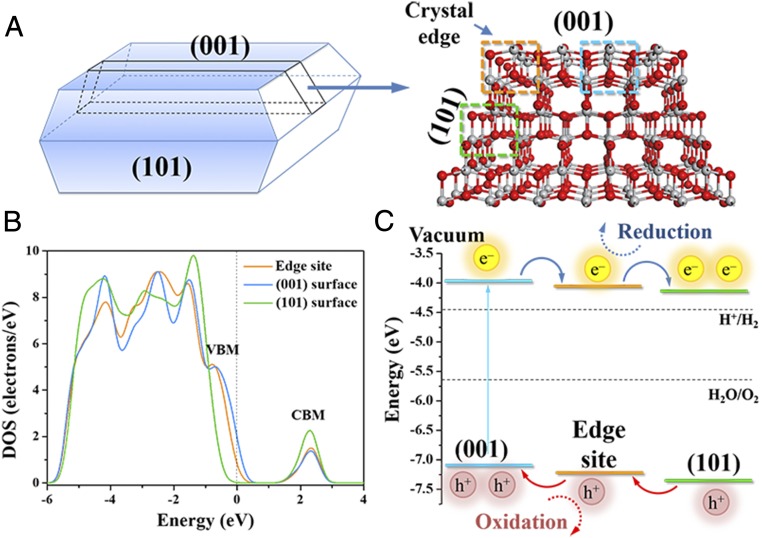
Fig. 6.
Cluster model of anatase TiO2 and the electronic structures. (A) Model of anatase TiO2 with both (001) and (101) surfaces and their crystal edge. The sites in the dotted boxes were used for analyzing the DOS. (B) DOS of the edge site, the (001) surface, and the (101) surface of the cluster model without the scissor operator. (C) The relatively energy level of the bands for different photocatalytic sites from the positions of the VBM and the CBM in DOS and the flow route of photogenerated charge carriers.

