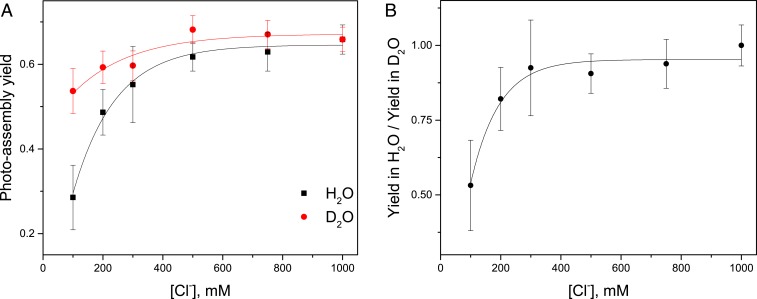
Fig. 3.
Chloride dependence of photoassembly yield varies in H2O and D2O. (A) Photoassembly was performed in buffers containing H2O or D2O for 20 min at 50 μE⋅m−2⋅s−1 at variable chloride concentrations. Buffer pL was 6.05. Other conditions were similar to Fig. 2. Photoassembly yield was measured as O2 evolution rates in H2O. (B) Ratio of the observed photoassembly yield in H2O vs. D2O varies with chloride concentration. Data with error bars represent average values and SE (n = 3 to 6).

