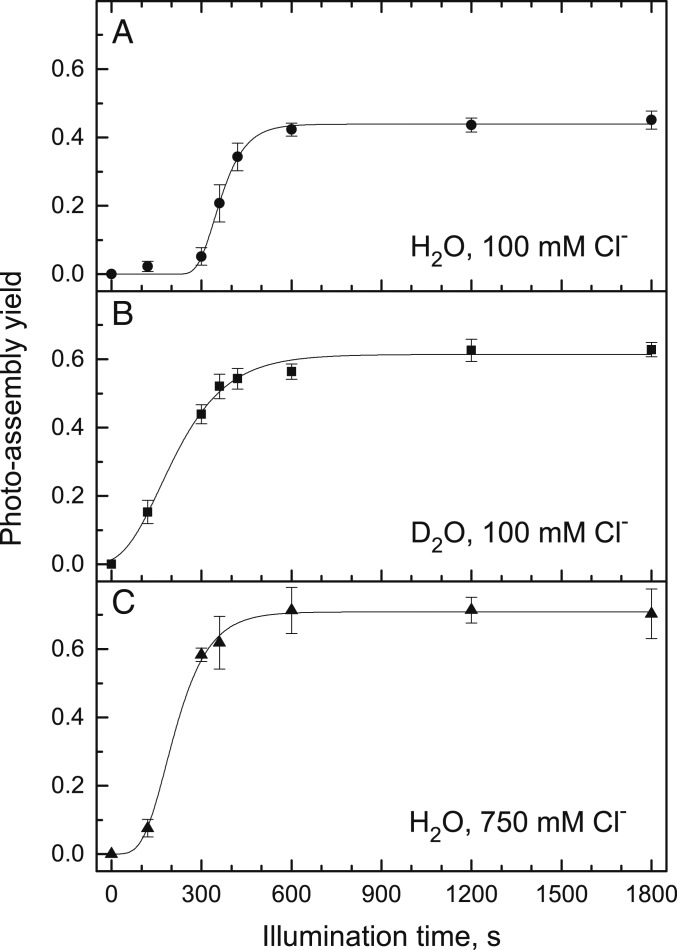
Fig. 4.
Rates of photoassembly are dependent on solvent and chloride concentration. Samples were photoassembled at 50 μE⋅m−2⋅s−1 for variable times. Sample conditions are identical to Fig. 3. Photoassembly was performed in H2O, pH 6.05, with 100 mM total Cl− (A); D2O, pL 6.05, with 100 mM total Cl− (B); or H2O, pH 6.05, with 750 mM total Cl− (C). Data with error bars represent average values and SE (n = 3 to 6). Traces represent kinetic analyses described in Table 1.

