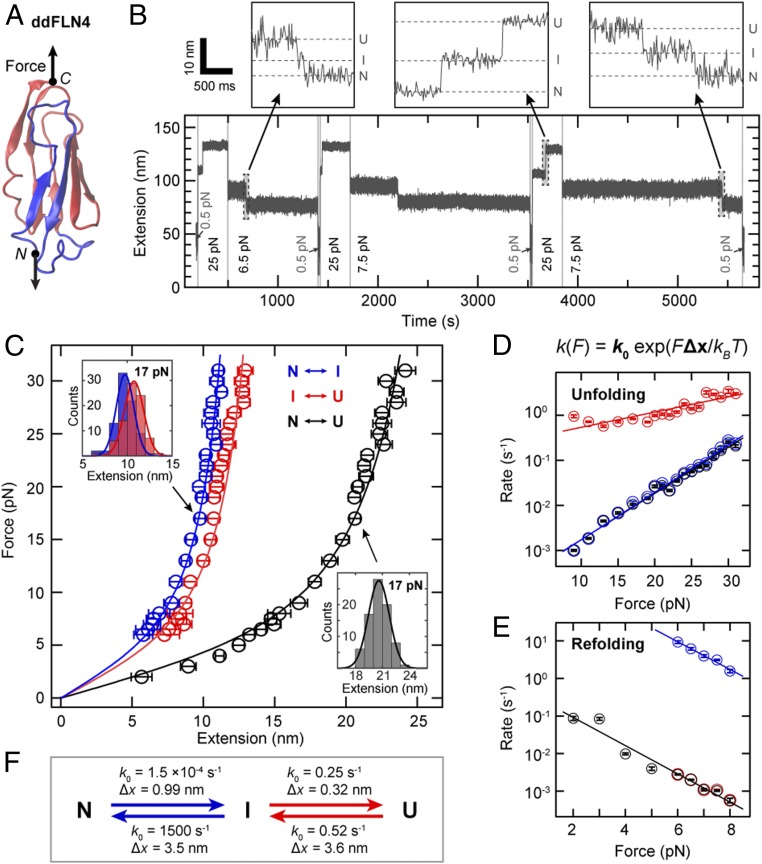
Fig. 2.
Three-state folding and unfolding of ddFLN4 at constant force. (A) Structure of ddFLN4 [Protein Data Bank ID code 1KSR (83), rendered using VMD (84)], with strands A and B rendered in blue and strands C–G forming the structured portion of the intermediate state, in red. Arrows indicate the direction of force acting on ddFLN4’s termini during MT experiments. (B) Extension vs. time trace of a ddFLN4 tether subjected to alternating intervals of high force (here 25 pN) allowing for ddFLN4 unfolding, intermediate force (here 6.5 or 7.5 pN) allowing for direct observation of refolding, and low force (0.5 pN) to ensure refolding before the next cycle. Unfolding and refolding of ddFLN4 via the mandatory intermediate state are observed as upward or downward double steps in the traces, respectively. Dashed lines in B, Insets indicate extension levels corresponding to the native (N), intermediate (I), and unfolded (U) states, respectively. (C) Force-extension profiles of ddFLN4 for the transitions N ↔ I (blue) and I ↔ U (red) and for full (un)folding N ↔ U (black). Data points are obtained by Gaussian fits to step extension histograms (C, Insets) at each constant force. Data points above 8 pN are from unfolding (based on 68–131 events obtained from 27–36 independent tethers), and data points up to 8 pN from refolding (54–159 events from 26–39 independent tethers). Error bars correspond to the full width at half maximum (FWHM) of Gaussian fits, divided by the square root of counts. Lines are fits of the WLC model. (D) Rates of unfolding at different constant forces for the 3 transitions. Color code is as in C. Error bars correspond to 95% CIs of exponential fits to the fraction of observed events as a function of time (Materials and Methods and SI Appendix, Fig. S8). Lines are fits of a single-barrier kinetic model. (E) Rates of refolding at different constant forces. Color code, error bars, and fits are analogous to D. (F) Fitted rates at zero force k0 and distances to the transition state Δx for the unfolding and refolding transitions as determined from the fits of a single-barrier kinetic model shown in D and E.

