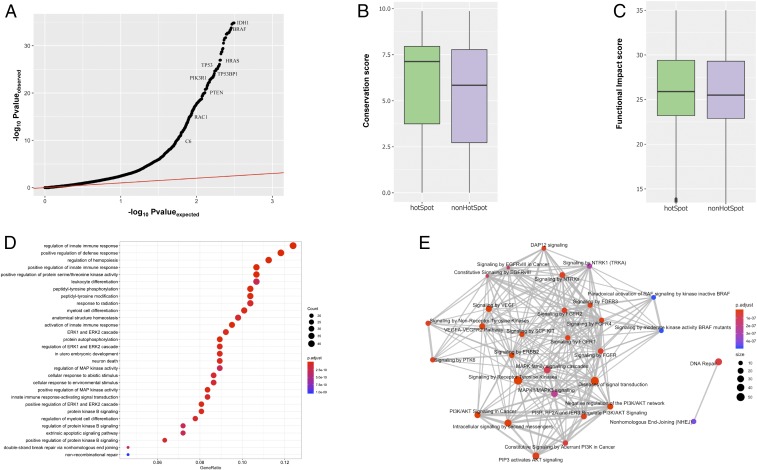
Fig. 2.
Pan-cancer analysis of putative driver genes with hotspot communities. (A) Pan-cancer QQ plot for genes with hotspot communities. (B) PhyloP conservation score comparisons between mutations occupying hotspot communities against nonhotspot communities on protein structures. (C) CADD score correlation between mutations occupying hotspot communities and nonhotspot communities on protein structures. (D) Biological process enrichment analysis for putative driver genes with at least 1 hotspot. The x axis corresponds to the gene ratio quantifying the fraction of putative driver genes belonging to a particular biological process. The color code and size correspond to corrected P value and number of genes involved in the biological process, respectively. (E) Reactome-based pathway enrichment analysis. The color code and size quantify to corrected P value and number of genes involved in the biological process, respectively.

