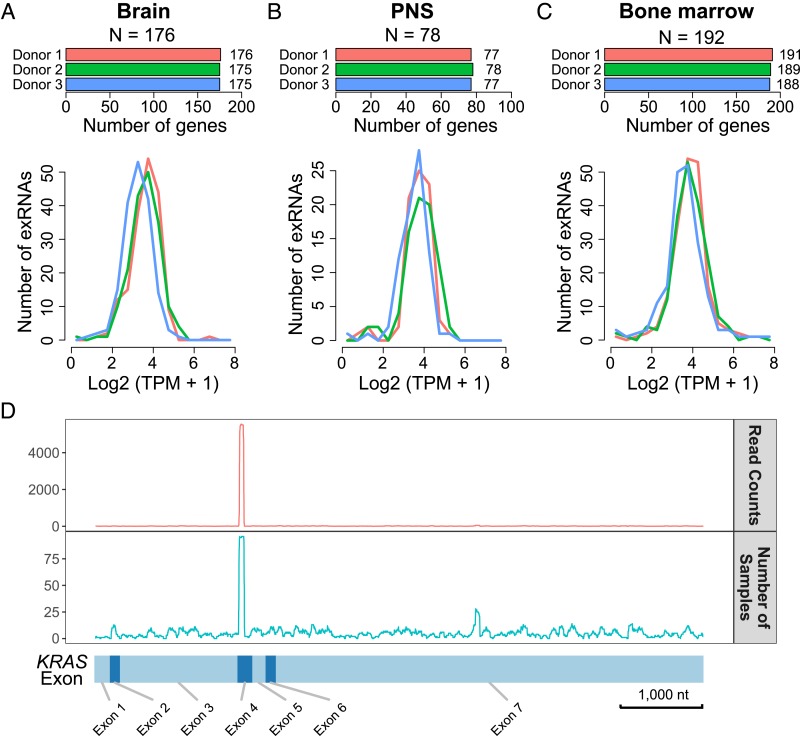
Fig. 2.
Presence of exRNAs derived from genes with tissue-specific expression. (A–C) Number and expression levels of the exRNAs derived from (A) brain-, (B) PNS-, and (C) bone marrow-specific genes. (Upper) The number of detected exRNAs in each donor. N, the total number of genes that are specifically expressed in this tissue. (Lower) Distribution of the expression of the exRNAs derived from the corresponding tissue-specific genes. (D) Distribution of SILVER-seq reads on all of the KRAS exons (x axis). (Upper) Cumulative read counts from all serum samples. (Lower) The number of serum samples with reads mapped to respective KRAS exons.

