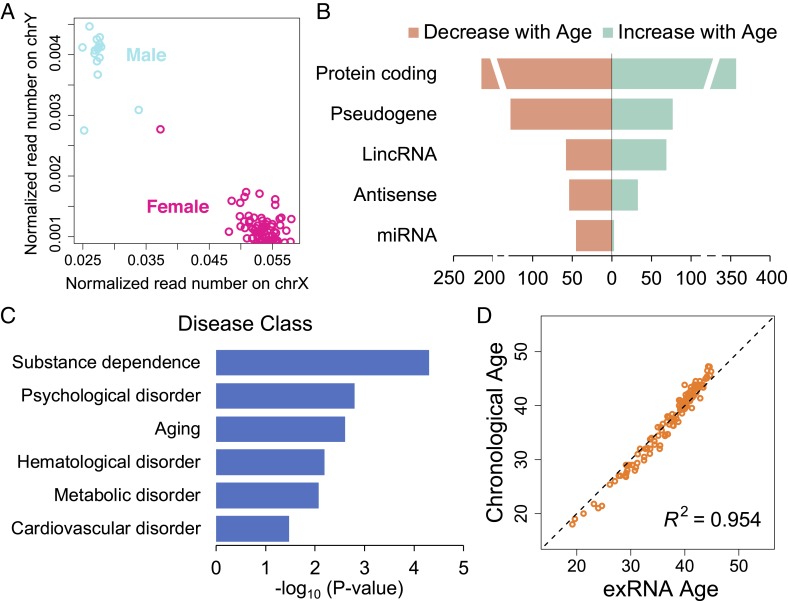
Fig. 3.
Correlations of exRNA expression with sex and age. (A) Scatter plot of normalized SILVER-seq reads mapped to X (x axis) and Y (y axis) chromosomes of every serum sample (circle). Male and female samples are colored in blue and red, respectively. (B) Numbers of exRNAs that are positively (green) and negatively (pink) correlated with age in each RNA type (row). (C) Disease classes (rows) that are associated with age-correlated exRNA genes; x axis, adjusted P value from association tests. (D) Scatter plot of exRNA age (x axis) and chronological age (y axis) for every sample (circle).

