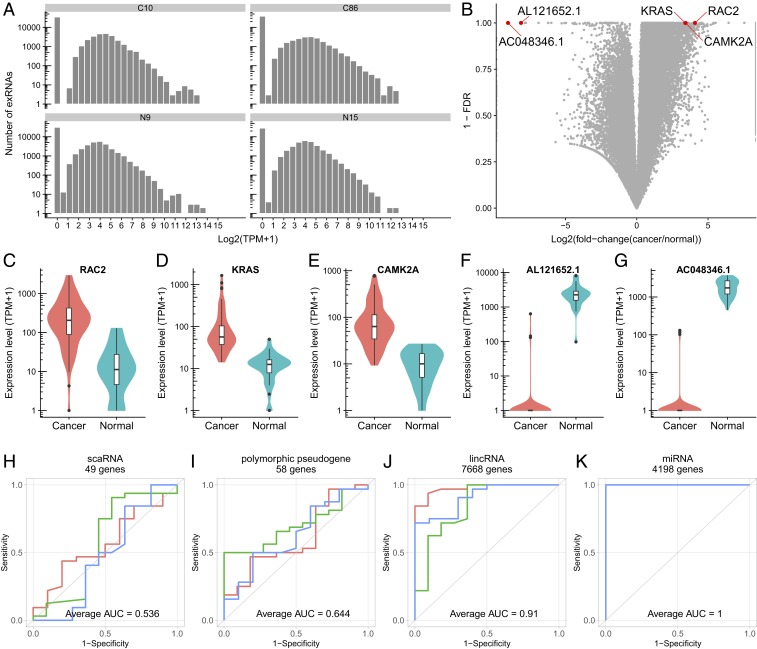
Fig. 4.
The exRNA expression in cancer and normal serum samples. (A) Distribution of exRNA expression levels of every gene in the human genome (60,675 genes in total, hg38) in 2 representative cancer samples (C10, C86) and 2 representative normal samples (N9, N15). See SI Appendix, Fig. S9 for all other samples. (B) Volcano plot of log fold change (cancer/normal) (x axis) and FDR (y axis) for all exRNAs (dots). (C–G) Expression levels of (C) RAC2, (D) KRAS, (E) CAMK2A, and (F) AL121652.1 and (G) AC048346.1 exRNA in cancer (red) and normal serum (blue). (H–K) receiver operating characteristic (ROC) curves of classification results based on (H) scaRNA, (I) polymorphic pseudogene, (J) lincRNA, and (K) miRNA, based on 3-fold cross-validations (red, green, blue).

