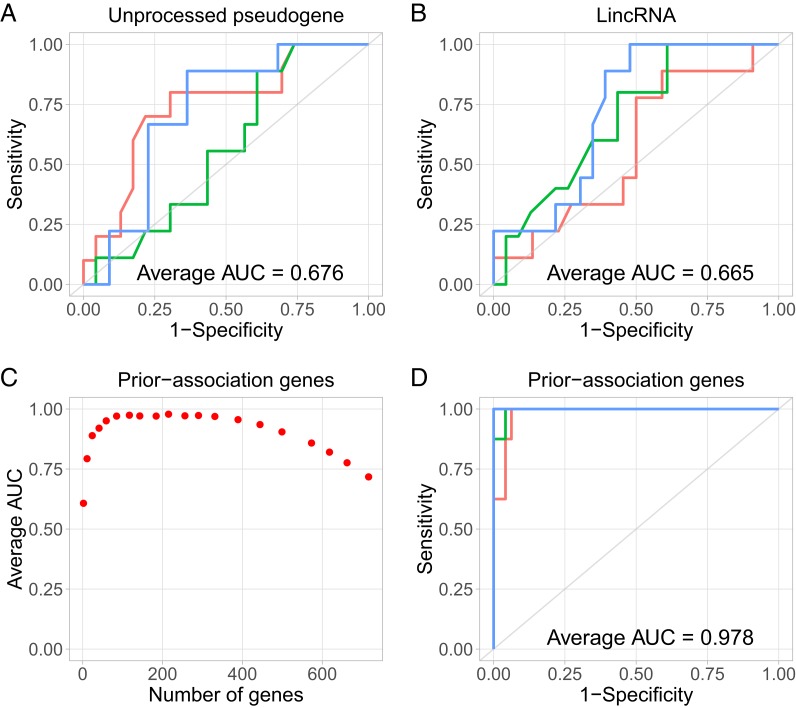
Fig. 5.
Classification of serum samples from patients with or without cancer recurrence. (A and B) Representative ROC curves from cross-validations, using all of the genes of each RNA type as features, including (A) unprocessed pseudogenes and (B) lincRNAs. (C and D) Classifications based on prior-association genes. (C) Average AUC of 100 cross-validations (y axis) based each number of prior-association genes used as features (x axis). (D) Representative ROC curves from 100 cross-validation based on 215 prior-association genes as features.

