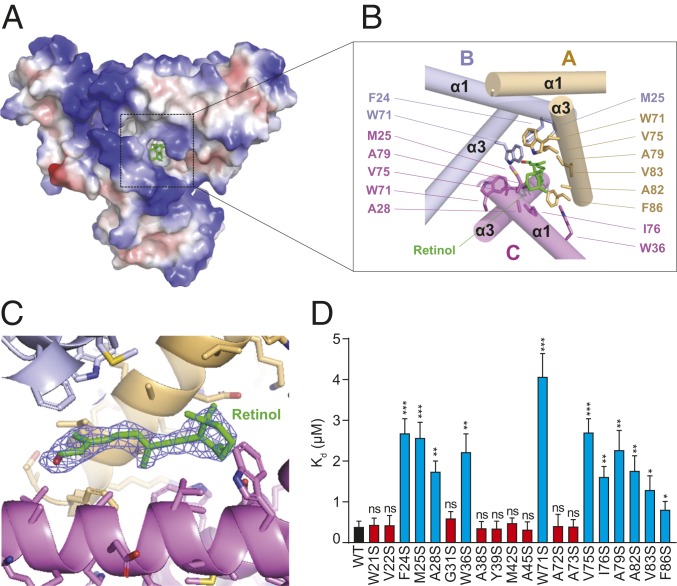
Fig. 4.
Retinol-binding pocket of SAA3. (A) Electrostatic surface representations of the SAA3 trimer with the bound retinol shown as green sticks. White, blue, and red indicate neutral, positive, and negative surfaces, respectively. (B) Detailed interactions between SAA3 and retinol from the area highlighted in A. Residues from each chain are labeled and shown in different colors. (C) Electron density, 2Fo − Fc (blue, contoured at 0.8 σ), of the bound retinol under Coot. The retinol molecule was omitted for calculation of the molecule electron density. (D) Mutagenesis of SAA3 identifying key residues that mediate the interaction between SAA3 and retinol. Dissociation constant (Kd) values between retinol and each SAA3 mutant were determined by a fluorometric retinol-binding assay (SI Appendix, Fig. S11) and are shown as mean ± SEM. ns, not significant; *P < 0.05; **P < 0.01; ***P < 0.001 as determined by 2-tailed Student’s t test.

