Fig. 2.
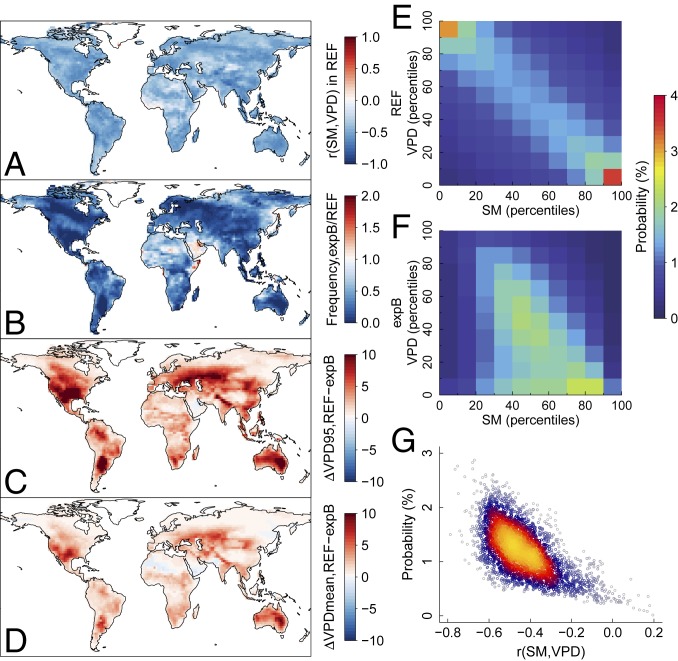
SM-VPD relationship in GLACE-CMIP5 expB and REF simulations. (A) Correlation coefficient between SM and VPD [r(SM,VPD)] in REF during the period 1981–2080 (warm season). (B) Ratio of the frequency of extreme high VPD (above 95th percentile VPD in REF) between expB and REF. (C and D) Difference in (C) 95th percentile VPD (hPa) and (D) mean VPD (hPa) between REF and expB. (E and F) Mean probability of each percentile bin of VPD and SM across all grid cells in (E) REF and (F) expB. The percentile bins are sorted according to SM and VPD values in REF, and the bins are consistent in REF and expB. (G) Spatial relationship between r(SM,VPD) and the probability of concurrent VPD and SM extremes (above 95th percentile VPD and below 5th percentile SM) in REF simulations.

