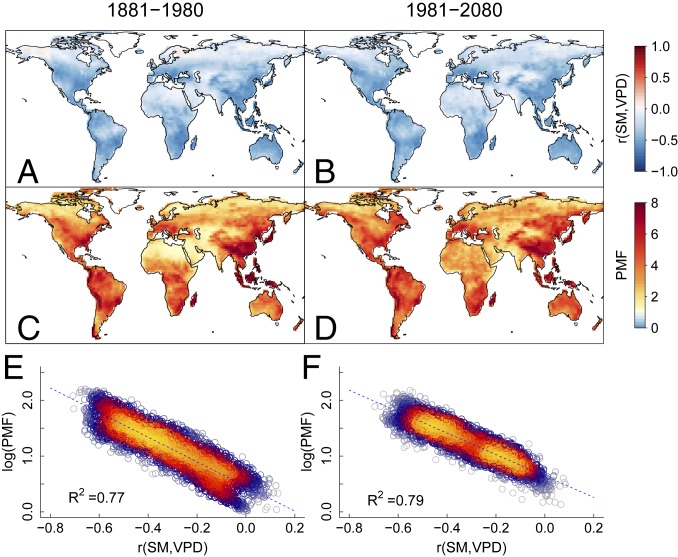
Fig. 3.
SM-VPD correlation and probability multiplication factor (PMF) in CMIP5. (A and B) Mean correlation coefficient [r(SM,VPD)] between SM and VPD across 61 pairs of historical and future simulations. (C and D) Model mean PMF of concurrent extreme VPD above its 95th percentile and extreme SM below its 5th percentile. (E and F) Relationship between r(SM,VPD) and PMF across the land grids (excluding Greenland and Antarctica) for historical and future simulations.

