Fig. 3.
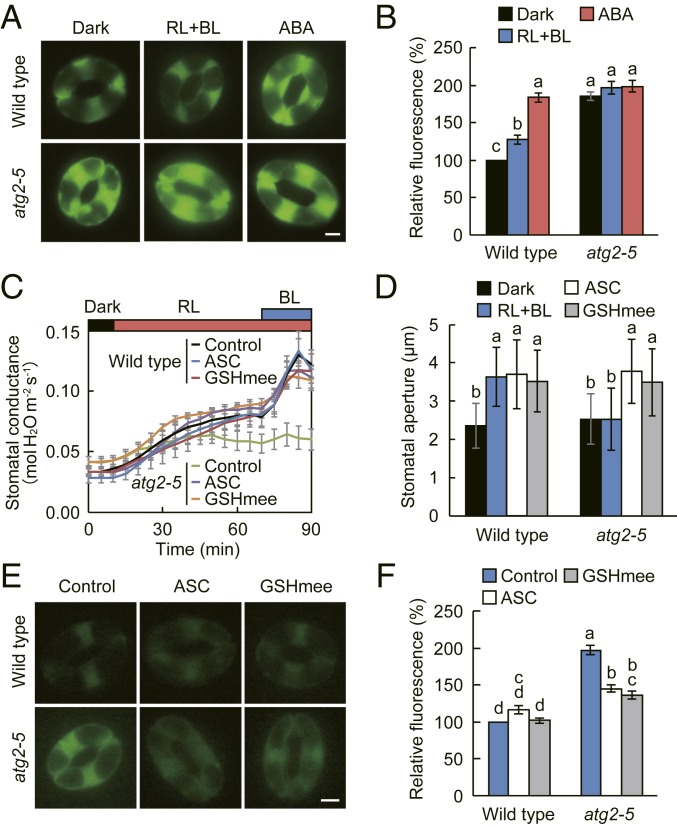
ROS accumulation in atg2 guard cells and restoration of stomatal opening and ROS levels by antioxidants. (A and B) ROS accumulation in atg2 mutant guard cells. Images of ROS accumulation in guard cells indicated by the fluorescence dye H2DCFDA (A) and quantification of the relative ROS levels analyzed using ImageJ software (B). Epidermal strips were incubated in the dark or under red (RL: 50 µmol m−2 s−1) and blue light (BL: 10 µmol m−2 s−1) for 1.5 h, and then loaded with H2DCFDA for 30 min. After excess dye was removed by washing, abscisic acid (ABA) at 10 µM was added, and reactions were allowed to proceed under RL and BL for an additional 30 min. (Scale bar: 5 µm.) Data represent means ± SEM (n = 90, pooled from triplicate experiments). (C and D) Restoration of light-dependent stomatal opening in intact leaves (C) and epidermis (D) of atg2-5 mutant by ascorbic acid (ASC) and glutathione methyl ester (GSHmee). For C, leaves of dark-adapted plants were illuminated with RL and BL as described in Fig. 1B. During dark adaptation, 10 mM ASC or 10 µM GSHmee was applied to the soil, and plants were incubated for at least 9 h before the measurements. Data represent means ± SEM (n = 6). For D, epidermal strips were incubated as described in Fig. 1C in the presence of 10 mM ASC or 10 µM GSHmee. Data represent means ± SD (n = 75, pooled from triplicate experiments). (E and F) Scavenging of ROS by ASC and GSHmee in atg2-5 mutant guard cells. Epidermal strips were prepared from dark-adapted plants as described in Fig. 3C, and the ROS levels were determined using H2DCFDA. (Scale bar: 5 µm.) Data represent means ± SEM (n = 90, pooled from triplicate experiments). For (B, D, and F) lowercase letters a, b, c, and d indicate significant difference (ANOVA with Tukey’s test, P < 0.01).

