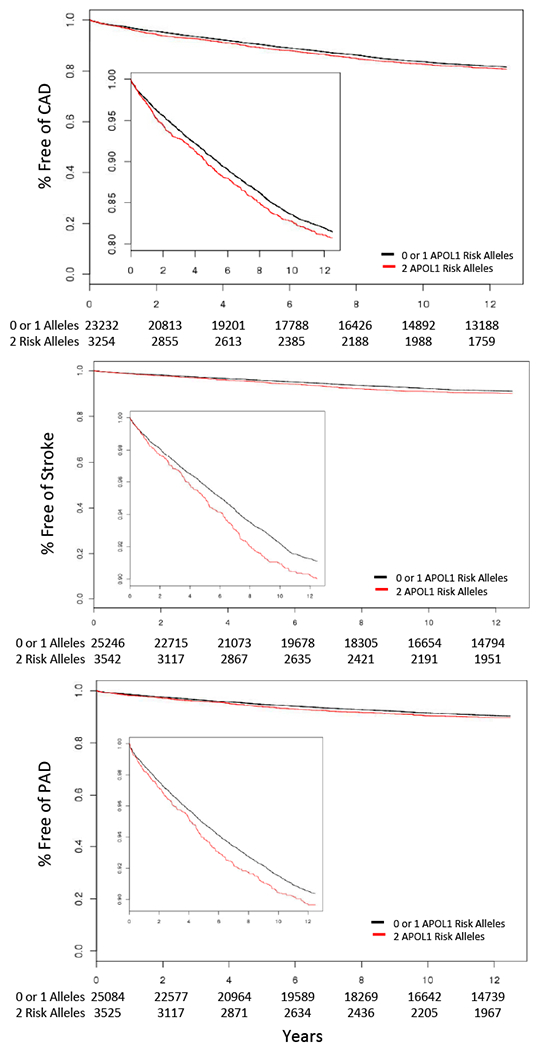
Figure 1. Association of APOL1 and incident CAD, Stroke and PAD.

Kaplan Meier plots depicting disease free survival amongst individuals free of kidney disease at baseline over the 12.5 year follow up period stratified by APOL1 2 risk allele status. Data is censored at last VA clinical encounter or upon developing chronic kidney disease. Inset plots displays the same data on an expanded y-axis. Risk-sum tables for each phenotype are displayed below the x axis. CAD, coronary artery disease; PAD, peripheral artery disease.
